Ranked:
The World’s Richest Countries (2006-2026)
By Gabriel Cohen
Visual Capitalist, October 6, 2026
https://www.visualcapitalist.com/ranked-the-worlds-richest-countries-2006-2026/?mc_cid=86065ac38c&mc_eid=72fdbad79d


Ranked:
The World’s Richest Countries (2006-2026)
By Gabriel Cohen
Visual Capitalist, October 6, 2026
https://www.visualcapitalist.com/ranked-the-worlds-richest-countries-2006-2026/?mc_cid=86065ac38c&mc_eid=72fdbad79d
Ranked: Where GDP Per Capita Grew Fastest Since 1990
By Dorothy Neufeld
Visual Capitalist, September 17, 2026
(O Brasil NÃO ESTÁ nessa tropa)
Over the last 35 years, some countries have seen extraordinary increases in economic output per person, ranging from export-driven Asian economies to resource-rich nations experiencing major commodity booms.
This graphic ranks countries by real GDP per capita growth from 1990 to 2025, based on World Bank data. Figures account for inflation and differences in purchasing power across countries.
Guyana’s extraordinary growth is closely tied to its offshore oil boom. Oil production began in 2019 and reached roughly 225 million barrels in 2024, transforming the economy of a country with fewer than one million people.

The New World Map the UN Wants You to Use
Visual Capitalist, Sept 16, 2026
The UN has endorsed a new world map using the Equal Earth projection.
See how the map compares and why Africa gains the most relative size.

Which Countries Rely Most on U.S. for Their Exports?
Visual Capitalist, September 14, 2026
The United States absorbs 18% of exports for the average G20 country.
For Canada and Mexico, there's a lot more dependence.
https://www.visualcapitalist.com/ranked-us-share-of-g20-exports/?mc_cid=f289c83b02&mc_eid=72fdbad79d
Just 0.9% of Russia’s exports go to the U.S., the lowest share among G20 countries.
Access to the United States, the world’s largest economy, remains crucial for countries around the world. However, America’s closest neighbors rely far more heavily on the U.S. market than other major global economies.
This visualization ranks Group of 20 (G20) countries by the share of their goods exports sent to the U.S., using the latest available data (2025) from UN Comtrade and the Observatory for Economic Complexity.
Only goods trade is included. The African Union and European Union are excluded despite being G20 members.
Why Canada and Mexico Rank So High
Canada and Mexico are particularly exposed to shifts in U.S. trade policy because of their deeply integrated trade relationships with the United States.
The U.S. absorbs 72.3% of Canadian exports and 81.9% of Mexican exports, compared with just 18.1% for the average G20 economy. This makes both countries particularly vulnerable to changes in U.S. trade policy.
The table below lists G20 economies alongside the U.S. share of their exports in 2025.
Rank Country Share of Exports Going to U.S.
1 🇲🇽 Mexico 81.9%
2 🇨🇦 Canada 72.3%
3 🇯🇵 Japan 18.6%
4 🇮🇳 India 18.3%
5 🇰🇷 South Korea 17.4%
6 🇬🇧 United Kingdom 15.9%
7 🇨🇳 China 14.7%
8 🇮🇩 Indonesia 11.0%
9 🇧🇷 Brazil 10.9%
10 🇮🇹 Italy 10.8%
11 🇦🇷 Argentina 9.6%
12 🇩🇪 Germany 9.4%
13 🇫🇷 France 8.6%
14 🇦🇺 Australia 7.4%
15 🇿🇦 South Africa 7.1%
16 🇹🇷 Turkiye 6.0%
17 🇸🇦 Saudi Arabia 4.3%
18 🇷🇺 Russia 0.9%
Decades of economic integration have helped produce this concentration. The North American Free Trade Agreement (NAFTA), which entered into force in 1994, reduced trade barriers between Canada, Mexico, and the United States. It was replaced by the USMCA in 2020.
More recently, the second Trump administration has imposed tariffs on both U.S. neighbors. Talks between Ottawa and Washington have broken down, leading to the imposition of retaliatory tariffs.
Meanwhile, Mexico, the most exposed G20 country, continues negotiations with the U.S. in an effort to avoid further tariffs on its agricultural and automotive sectors.
G20 Exports to the U.S.
Outside North America, no G20 country sends a comparable share of its exports to the United States. However, traditional U.S. allies including Japan (18.6%), South Korea (17.4%), and the United Kingdom (15.9%) still send substantial portions of their goods exports to the U.S.
European Union member states tend to have lower exposure to the U.S. market because of extensive trade within the bloc. Germany, the EU’s largest economy, sends 9.4% of its exports to the U.S., behind Italy (10.8%) but ahead of France (8.6%).
In Latin America, Argentina (9.6%) and Brazil (10.9%) send much smaller shares of their exports to the U.S. than Mexico does. China, the world’s largest exporter, sends less than 15% of its exports to the U.S.
Energy Exports to America
Saudi Arabia (4.3%) and Russia (0.9%) have the smallest U.S. shares among the G20 countries in the ranking. Both are major oil and gas exporters with large markets elsewhere, particularly in Asia and Europe.
The U.S. also sources significant amounts of energy closer to home. In addition to its own sizable oil and gas production, the country imports substantial quantities of oil from Canada. Canadian energy products have received different tariff treatment than many other imports during the ongoing trade dispute.
Canada’s role as a major U.S. oil supplier has also become part of the broader trade debate. Some prominent Canadian politicians have floated taxing oil exports to the U.S. as a way to pressure Washington.
Learn More on the Voronoi App
To explore the main exports of EU countries, check out Cars and Petroleum Dominate EU Exports on Voronoi.
Por vezes, quantidade também se traduz em qualidade: mesmo que vc descarte 90% da produção científica de alguns países (China e Índia, por exemplo), o que sobre ainda é relevante.

This was originally posted on our Voronoi app. Download the app for free on iOS or Android and discover incredible data-driven charts from a variety of trusted sources.
A country’s prosperity is often linked to the education level of its working-age population.
Highly educated workforces tend to have higher productivity, more capability for innovation, and offer more support for economic growth.
This chart shows the countries with the most educated populations, measured by both the number and share of adults aged 25–64 who have a bachelor’s degree or higher. The data comes from CBRE Research, using the latest available figures as of 2023.
How the Global Distribution of Wealth Has Changed (2000-2023)
This was originally posted on our Voronoi app. Download the app for free on iOS or Android and discover incredible data-driven charts from a variety of trusted sources.
People worldwide are becoming increasingly wealthier—and not just those who already own great wealth.
Over recent decades, the share of the global population with wealth between $10,000 and $100,000 has more than doubled, while the group in the lowest wealth segment (less than $10,000) has been nearly cut in half.
This graphic illustrates the shifts in global wealth distribution between 2000 and 2023, based on data from Art Basel and UBS.
The percentage of adults in the lowest wealth segment (under $10,000) decreased from 75% in 2000 to 40% in 2023. Most of these individuals reside in poorer countries, predominantly in Africa.
Meanwhile, the group with wealth between $10,000 and $100,000 has seen the most significant growth over the last two decades.
| Year | < $10k | $10k-$100k | $100k-$1m | > $1m |
|---|---|---|---|---|
| 2000 | 75% | 17% | 8% | 1% |
| 2010 | 56% | 32% | 12% | 1% |
| 2019 | 57% | 33% | 10% | 1% |
| 2022 | 53% | 34% | 12% | 1% |
| 2023 | 40% | 43% | 16% | 2% |
While the share of millionaires has doubled since 2000, they still account for only 2% of the global population. North America and the Middle East have experienced the largest percentage increase in the number of millionaires since 2016, with +52% and +50% growth, respectively.
Individuals with assets worth $100,000–$1 million have grown from 8% to 16% of the population.
According to UBS, the data shows that in every wealth band and over any time horizon, it’s consistently likelier for people to climb up the wealth ladder than slip down it, at least on a global level.
To learn more about this topic, check out this graphic that shows the global wealth distribution by region in 2023.

This was originally posted on our Voronoi app. Download the app for free on iOS or Android and discover incredible data-driven charts from a variety of trusted sources.
In July, Ukraine avoided defaulting on $20 billion in loans by reaching a preliminary agreement with private creditors.
Given the financial burden of war, the country suspended interest payments on international debt over the last two years, which was set to expire on August 1, 2024. Without this new debt restructuring, this default would have ranked among the 10 largest in recent history. The last time Ukraine defaulted on its debt was in 2015, after Russia’s invasion of Crimea.
This graphic shows the largest sovereign debt defaults since 1983, based on data from Moody’s via Aswath Damodaran.
Below, we show the biggest sovereign debt defaults between 1983 and 2022:
| Ranking | Country | Total Defaulted Debt | Date | Rating at Default |
|---|---|---|---|---|
| 1 | 🇬🇷 Greece | $264.2B | Mar 2012 | C |
| 2 | 🇦🇷 Argentina | $82.3B | Nov 2001 | Caa3 |
| 3 | 🇷🇺 Russia | $72.7B | Aug 1998 | Caa1 |
| 4 | 🇬🇷 Greece | $41.4B | Dec 2012 | C |
| 5 | 🇱🇧 Lebanon | $31.3B | Mar 2020 | Ca |
| 6 | 🇻🇪 Venezuela | $31.1B | Nov 2017 | Caa3 |
| 7 | 🇦🇷 Argentina | $29.4B | Jul 2014 | Caa2 |
| 8 | 🇪🇨 Ecuador | $17.3B | Apr 2020 | Caa3 |
| 9 | 🇺🇦 Ukraine | $13.3B | Oct 2015 | Ca |
| 10 | 🇦🇷 Argentina | $10.5B | Feb 2020 | Caa2 |
Greece’s $264.2 billion default in 2012 stands as the largest overall, unfolding when the country was mired in recession for the fifth consecutive year.
The country defaulted again just nine months later, making it the fourth-largest ever. Leading up to the crash, Greece ran significant deficits despite being one of the fastest-growing countries in Europe. Furthermore, in 2009, the newly elected prime minister revealed that the country was $410 billion in debt—substantially more than previous estimates.
With the second-highest default recorded, Argentina failed to repay interest on $82.3 billion in foreign debt in 2001. Like Greece, it is a repeat offender, defaulting numerous times since independence in 1816. Today, Argentina is the largest debtor to the International Monetary Fund, despite being Latin America’s third-largest economy.
Following next in line is Russia’s 1998 default on $72.7 billion in loans, coinciding with a currency crisis that erased more than two-thirds of the ruble’s value in a matter of weeks. That year, several other countries including Venezuela, Pakistan, and Ukraine defaulted on their debts after the Asian Financial Crisis of 1997 spurred instability in global financial markets.
Just as 1998 saw a wave of defaults, 2020 was a year marked by major debt upheavals. Due to the pandemic and collapsing oil prices, it was a record year for sovereign defaults, reaching seven in total. Among these, Lebanon, Ecuador, and Argentina saw the largest defaults amid deepening fiscal pressures.
Ranked: The Countries Sending the Most Remittances Abroad Want more content like this with daily insights from the world’s top creators? See it first on the
. posts.voronoiapp.com/money/-The-US-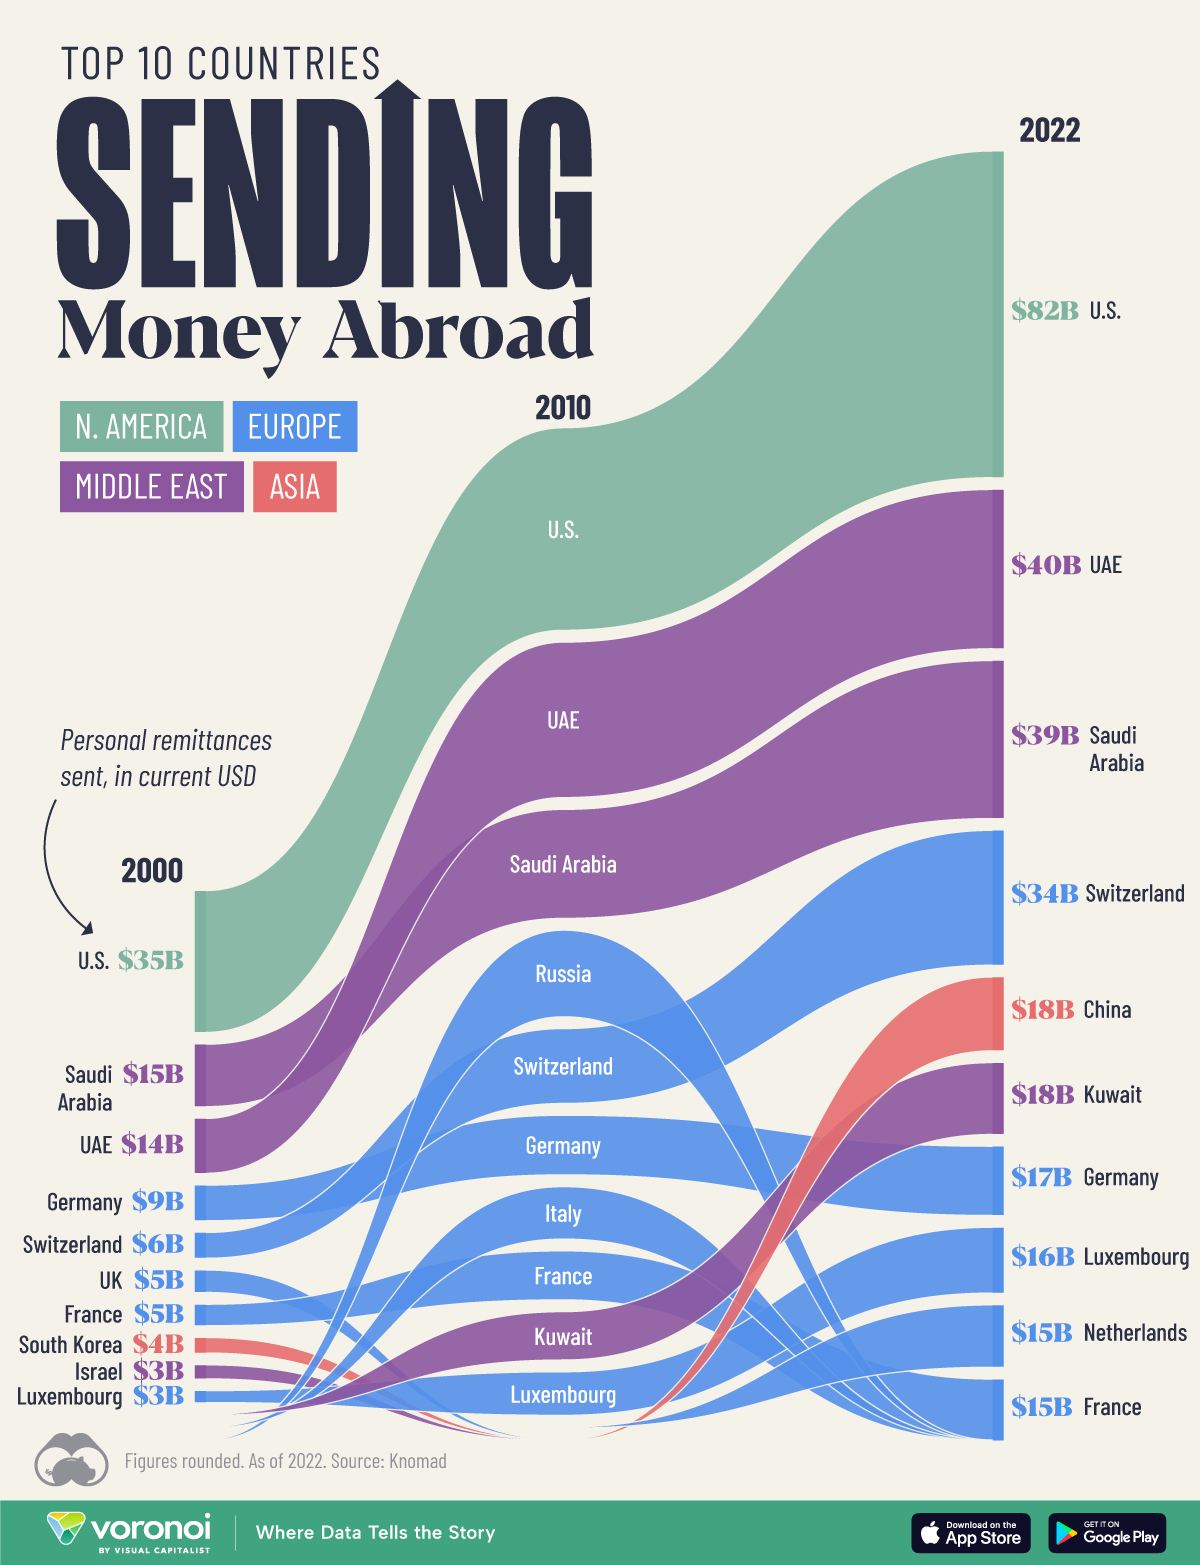

With over 200 countries existing across the world with unique cultures and traditions, one might assume that there are hundreds of types of government systems. But both historically and in modern times, that’s not the case.
Even while political regimes across these countries have changed over time, they’ve largely followed a few different types of governance. Today, every country can ultimately be classified into just nine broad forms of government systems.
This map by Truman Du uses information from Wikipedia to map the government systems that rule the world today.
It’s important to note that this map charts government systems according to each country’s legal framework.
Many countries have constitutions stating their de jure or legally recognized system of government, but their de facto or realized form of governance may be quite different.
Let’s take a closer look at some of these systems.
Brought back into the spotlight after the death of Queen Elizabeth II of England in September 2022, this form of government has a single ruler. They carry titles from king and queen to sultan or emperor, and their government systems can be further divided into three modern types: constitutional, semi-constitutional, and absolute.
A constitutional monarchy sees the monarch act as head of state within the parameters of a constitution, giving them little to no real power. For example, King Charles III is the head of 15 Commonwealth nations including Canada and Australia. However, each has their own head of government.
On the other hand, a semi-constitutional monarchy lets the monarch or ruling royal family retain substantial political powers, as is the case in Jordan and Morocco. However, their monarchs still rule the country according to a democratic constitution and in concert with other institutions.
Finally, an absolute monarchy is most like the monarchies of old, where the ruler has full power over governance, with modern examples including Saudi Arabia and Vatican City.
Unlike monarchies, the people hold the power in a republic government system, directly electing representatives to form government. Again, there are multiple types of modern republic governments: presidential, semi-presidential, and parliamentary.
The presidential republic could be considered a direct progression from monarchies. This system has a strong and independent chief executive with extensive powers when it comes to domestic affairs and foreign policy. An example of this is the United States, where the President is both the head of state and the head of government.
In a semi-presidential republic, the president is the head of state and has some executive powers that are independent of the legislature. However, the prime minister (or chancellor or equivalent title) is the head of government, responsible to the legislature along with the cabinet. Russia is a classic example of this type of government.
The last type of republic system is parliamentary. In this system, the president is a figurehead, while the head of government holds real power and is validated by and accountable to the parliament. This type of system can be seen in Germany, Italy, and India and is akin to constitutional monarchies.
It’s also important to point out that some parliamentary republic systems operate slightly differently. For example in South Africa, the president is both the head of state and government, but is elected directly by the legislature. This leaves them (and their ministries) potentially subject to parliamentary confidence.
Many of the systems above involve multiple political parties vying to rule and govern their respective countries.
In a one-party state, also called a single-party state or single-party system, only one political party has the right to form government. All other political parties are either outlawed or only allowed limited participation in elections.
In this system, a country’s head of state and head of government can be executive or ceremonial but political power is constitutionally linked to a single political movement. China is the most well-known example of this government system, with the General Secretary of the Communist Party of China ruling as the de facto leader since 1989.
The final form of government is a provisional government formed as an interim or transitional government.
In this system, an emergency governmental body is created to manage political transitions after the collapse of a government, or when a new state is formed. Often these evolve into fully constitutionalized systems, but sometimes they hold power for longer than expected.
Some examples of countries that are considered provisional include Libya, Burkina Faso, and Chad.
Visual Capitalist, March 18. 2023
For much of human history, most people did not live in cities.
Cities—settlements that are densely populated and self-administered—require many specific prerequisites to come into existence. The most crucial, especially for much of human history, is an abundance of food.
Surplus food production leads to denser populations and allows for people to specialize in other skills that are not associated with basic human survival.
But that also means that cities usually consume more primary goods than they produce. And their size requires a host of many other services—such as transport and sanitation—that are traditionally expensive to maintain. So maintaining large urban centers, and especially the world’s largest cities, was a monumental task.
Mapper and history YouTuber Ollie Bye has visualized the seven largest cities in the world since 3,000 BCE. His video covers cities with a minimum population of 10,000 and hints at historical events which led to the establishment, growth, and eventual fall of cities.
With any historical data, accuracy is always a concern, and urban populations were rough and infrequent estimates up until the Industrial Revolution.
Bye has used a variety of data sources—including the UN and many research papers—to create the dataset used in the video.
In some places he also had to rely on his own estimates and criteria to keep the data reasonable and consistent:
Here’s a look at the largest city starting from the year 3,000 BCE, with populations listed in millions during the last year of each city’s “reign.” Cities are also listed with the flags of current-day countries in the same location.
| Time Period | Largest City | Population (Millions) | Country |
|---|---|---|---|
| 3000-2501 BCE | Uruk | 0.08 | Iraq  |
| 2500-2251 BCE | Lagash | 0.06 | Iraq |
| 2250-2001 BCE | Girsu | 0.08 | Iraq |
| 2000-1751 BCE | Isin | 0.04 | Iraq |
| 1750-1251 BCE | Babylon | 0.06 | Iraq |
| 1250-1001 BCE | Pi-Ramesses | 0.16 | Egypt  |
| 1000-601 BCE | Thebes | 0.12 | Egypt |
| 600-301 BCE | Babylon | 0.20 | Iraq |
| 300-201 BCE | Carthage | 0.40 | Tunisia  |
| 200 BCE-270 CE | Alexandria | 0.60 | Egypt |
Considered the “cradle of civilization,” the Fertile Crescent in the Middle East was home to all seven of the largest cities in the world in 3,000 BCE.
The Sumerian city of Uruk (modern-day Iraq), allegedly home to the legendary king Gilgamesh, topped the list with 40,000 people. It was followed by Memphis (Egypt) with 20,000 inhabitants.
For the next 1,700 years, other Mesopotamian cities in modern-day Iraq and Syria held pole positions, growing steadily and shuffling between themselves as the largest.
2,250 BCE marked the first time a different Asian city—Mohenjo-Daro (modern-day Pakistan) from the Indus Valley Civilization—found a spot at #4 with 40,000 people.
The table below is a quick snapshot of the seven largest cities in the world for from 3,000 BCE to 200 CE. Again, populations are listed in millions.
| Rank | 3000 BCE | 2250 BCE | 1250 BCE | 200 CE |
|---|---|---|---|---|
| 1 | Uruk (0.04) | Girsu (0.08) | Pi-Ramesses (0.16) | Alexandria (0.60) |
| 2 | Memphis (0.02) | Mari (0.05)  | Yin (0.12)  | Pataliputra (0.35)  |
| 3 | Umma (0.02) | Umma (0.04) | Thebes (0.08) | Carthage (0.20) |
| 4 | Nagar (0.02) | Mohenjo-daro (0.04)  | Sapinuwa (0.07)  | Luoyang (0.20) |
| 5 | Lagash (0.02) | Akkad (0.03) | Babylon (0.07) | Seleucia (0.20) |
| 6 | Larak (0.01) | Uruk (0.03) | Hattusa (0.06) | Pergamon (0.20) |
| 7 | Eridu (0.01) | Memphis (0.03) | Uruk (0.03) | Taxila (0.10) |
It wasn’t until 1,250 BCE that the top two spots were taken by cities in different regions: Pi-Ramesses (Egypt) and Yin(China), both with more than 100,000 residents.
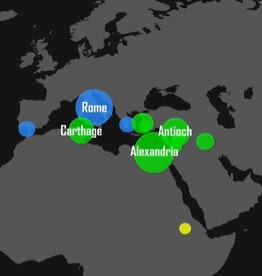
Egyptian cities would continue to be the most populous for the next millennium—briefly interrupted by Carthage and Babylon—until the start of the Common Era. By 30 CE, Alexandria was the largest city in the world, but the top 10 had representatives from the Middle East, Northern Africa, and Asia.
One city in Europe meanwhile, was also beginning to see steady growth—Rome.
It took until halfway through the 3rd century C.E. for Rome to become the most populous city, followed closely still by Alexandria (Egypt). Meanwhile in Iraq, Ctesiphon, the capital of the Sasanian empire was growing rapidly.
| Rank | 271 CE | 351 CE | 501 CE | 645 CE |
|---|---|---|---|---|
| 1 | Rome (0.39)  | Constantinople (0.29) | Ctesiphon (0.41) | Chang'an (0.38) |
| 2 | Alexandria (0.37) | Ctesiphon (0.25) | Constantinople (0.40) | Constantinople (0.32) |
| 3 | Luoyang (0.20) | Rome (0.24) | Luoyang (0.20) | Kanyakubja (0.24) |
| 4 | Vaishali (0.17) | Pataliputra (0.22) | Teotihuacan (0.15)  | Luoyang (0.21) |
| 5 | Carthage (0.16) | Luoyang (0.20) | Jiankang (0.15) | El Pilar (0.17)  |
| 6 | Teotihuacan (0.14) | Vaishali (0.16) | Caracol (0.14) | Ctesiphon (0.41) |
| 7 | Antioch (0.12) | Teotihuacan (0.15) | Chang'an (0.10) | Teotihuacan (0.15) |
Towards the end of the 3rd century, the Roman empire was divided into two, with Constantinople becoming the new capital for the Eastern half. Consequently, it had outgrown Rome by 353 and become the world’s most populous city, and for the next few centuries would reclaim this title time and time again.
In the 9th century, Baghdad became the first city to have 1 million residents (though historians also estimate Rome and the Chinese city of Chang’an may have achieved that figure earlier).
It would be nearly nine centuries until a city had one million inhabitants again, and Baghdad’s reign didn’t last long. By the 10th century, Bian, the capital of the Northern Song dynasty in China, had become the largest city in the world, with Baghdad suffering from relocations and shifting political power to other cities in the region.
| Rank | 850 CE | 985 CE | 1316 CE | 1381 CE |
|---|---|---|---|---|
| 1 | Baghdad (1.00) | Bian (0.35) | Cairo (0.44) | Vijayanagara (0.36) |
| 2 | Chang'an (0.60) | Cordoba (0.33) | Hangzhou (0.43) | Cairo (0.35) |
| 3 | Constantinople (0.27) | Constantinople (0.32) | Dadu (0.40) | Paris (0.29)  |
| 4 | Kanyakubja (0.21) | Angkor (0.18)  | Paris (0.25) | Yingtian (0.27) |
| 5 | Luoyang (0.20) | Baghdad (0.17) | Kamakura (0.20)  | Hangzhou (0.23) |
| 6 | Bian (0.17) | Kyoto (0.15) | Guangzhou (0.15) | Beiping (0.15) |
| 7 | Cordoba (0.16) | Cairo (0.12) | Fez (0.14)  | Tabriz (0.14)  |
From the 12th century onwards, Mongol invasions in the Middle East and Central Asia severely limited population growth in the region. European cities too were ravaged in the 14th century, but by plagues instead of marauders.
For the next few hundred years, Cairo (Egypt), Hangzhou (China), and Vijayanagara (India) would top the list until Beijing took (and mostly held onto) the top spot through the 19th century.
The start of the Industrial Revolution in the UK—spreading to the rest of Europe and later on the U.S.—led to hitherto unseen levels of urban population growth.
Factories needed labor, which caused mass emigration from the rural countryside to urban centers of growth.
In 1827, London passed Beijing to become the largest city in the world with 1.3 million residents. Over the next 100 years, its population increased nearly 7 times, remaining the most populous city until the end of World War I, by which time it was overtaken by New York.
| Rank | 1442 | 1851 | 1919 | 1955 |
|---|---|---|---|---|
| 1 | Beijing (0.51) | London (2.2)  | New York (7.6)  | Tokyo (13.7) |
| 2 | Vijayanagara (0.44) | Beijing (1.6) | London (7.4) | New York (13.2) |
| 3 | Cairo (0.37) | Paris (1.3) | Paris (4.7) | Osaka (8.6) |
| 4 | Hangzhou (0.24) | Guangzhou (0.87) | Tokyo (4.3) | London (8.2) |
| 5 | Tabriz (0.21) | Constantinople (0.71) | Berlin (3.7)  | Paris (6.7) |
| 6 | Nanjing (0.18) | Edo (0.78) | Chicago (2.9) | Buenos Aires (5.9)  |
| 7 | Granada (0.15)  | New York (0.56) | Vienna (1.9)  | Moscow (5.7)  |
From 1920 to 2022, the world population quadrupled thanks to improvements in farming and healthcare, and cities saw rapid growth as well. The beginning of the 20st century saw the top 10 largest cities in the world in the U.S., Europe, and Japan.
By the 21st century however, growth shifted away to other parts of the world and by 2021, the top seven had cities only from Asia and the Americas.
| Rank | 1970 | 1990 | 2000 | 2021 |
|---|---|---|---|---|
| 1 | Tokyo (23.2) | Tokyo (32.7) | Tokyo (34.3) | Tokyo (37.3) |
| 2 | New York (16.1) | Osaka (18.5) | Osaka (18.6) | New Delhi (31.1) |
| 3 | Osaka (15.2) | New York (16.2) | Mexico City (18.4) | Shanghai (27.7) |
| 4 | Mexico City (8.8) | Mexico City (15.9) | New York (17.8) | Sao Paulo (22.2)  |
| 5 | Buenos Aires (8.4) | Sao Paulo (15.0) | Sao Paulo (17.0) | Mexico City (21.9) |
| 6 | Los Angeles (8.3) | Bombay (12.7) | Mumbai (16.1) | Dhaka (21.7)  |
| 7 | Paris (8.2) | Buenos Aires (11.2) | New Delhi (15.6) | Beijing (20.8) |
Tokyo, which took the top spot in 1954, is the largest city in the world today with a population of 37 million (including the entire metropolitan area).
It is followed by New Delhi with 31 million, but by 2028, the UN estimates that positions will switch on the leaderboard and New Delhi will overtake Tokyo.
The rise and fall of cities through the sands of time can give us insight into the trajectory of civilization growth. As civilizations grow, become richer, and reach their zenith, so too do their cities blossom in tandem.
For example, of the modern-day seven largest cities in the world, four of them belong to countries with the 10 largest economies in the world.
Meanwhile, sudden falls in urban population point to turbulence—political instability, wars, natural disasters, or disease.
Most recently Ukraine’s cities are seeing depopulation as residents flee conflict zones, raising the specter of a demographic crisis for the country should the war continue.
Thus, tracking the size of urban population can help policymakers forecast future roadblocks to growth, especially when prioritizing sustainable growth for a country.



