

By the end of the 2017–2018 period Brazil’s Effective Gross Domestic Product (to be defined later on the text), on an average yearly basis, had not fared better than it had during the pre-crisis years, 2010–2013. That is: while the quadrennium that preceded the 2015–2016 downturn (when Real GDP plummeted 6.8%) witnessed, on an average yearly basis, growth rates of 4.10%, the ensuing rebound starting in 2017, albeit sluggish, has brought in an average yearly Real GDP growth of 1.10%.
From a macroeconomic standpoint, thus, a reading the currently available statistics suggests a timid, underperforming, slow-paced recovery. Nonetheless, optimism remains high as some economists even forecast a 2020 GDP spike of +2,20% compared to this year (2019)mere 0,95%. Having said that, just how seriously can a +2% expected growth be taken, considering Brazil’s — and the world’s — current state of affairs? Let us talk some basic economics.
GDP vs. Real GDP vs. Nominal GDP
First off, some elementary definitions. Gross Domestic Product (GDP) is a macroeconomic measure of a country’s total output. It’ll tell you the market value of all final goods and services produced within a defined (generally a year) period of time. GDP can be either measured nominally or in real terms. What that means is that a nominal GDP (N-GDP) measures output at current prices while Real-GDP (R-GDP) assesses output from a base-year price.
For macroeconomic purposes, R-GDP is generally preferred over the nominal one because it factors out inflation. As it does so, R-GDP thus provides the reader with a real sense of output without the distortions caused by price fluctuations.
Let me offer you an example. In 2010 a hypothetical country produced ten loaves of bread. It was all sold at a market price of US$ 1,00/a loaf. It follows, then, that this country’s GDP is US$ 10,00. Time lapses and 2015 kicks in. For numerous reasons, the price per loaf of bread rises to US$ 2,00. The economy is now capable of producing fifteen loaves of bread. Assuming it was all sold, it follows that now GDP is US$ 30,00. It won’t take a wonk to tell that GDP has doubled, but has it really?
While production increased 5% (from 10 to 15 loaves of bread), GDP boasts a 200% increase at current (2015) prices! That’s nominal GDP. On the other hand, however, counting in at a base-year price will show us how much GDP would be today at a given past year’s prices, that is: inflation factored out. Then, 2015’s production of fifteen loaves of bread at 2010’s prices puts out a GDP, discounted for inflation, of US$ 15,00. A 50% difference that shows us how much output, not prices, has really grown. That’s Real GDP.
Having stated those differences, let us appreciate some real stats:

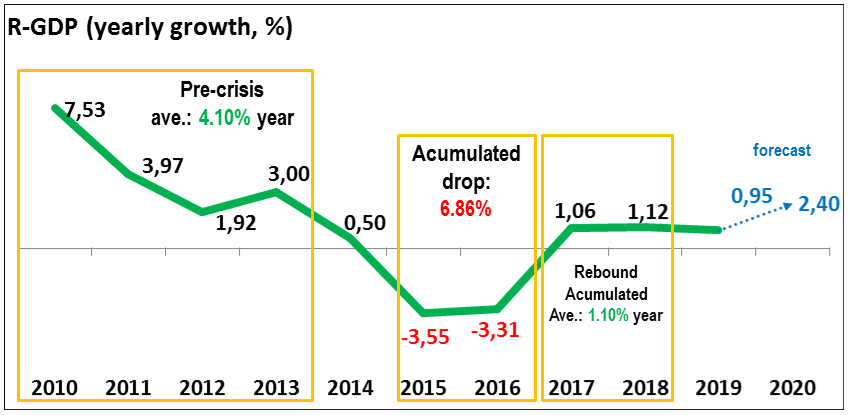
What you see is Brazil’s R-GDP over the past eight years (2010–2018) plus two forecasts: the current year’s (2019), and the upcoming one (2020). A closer reading of the numbers sheds light on the fact that, on an average yearly basis (and as stated earlier), the rebound started in 2017 plus 2018’s accumulated growth is well below the average yearly growth seen during the pre-crisis years. What that effectively tells us is that Brazil is faring less well than it potentially could. Comparing what a GDP can potentially be and what it effectively is is another paramount lens in macroeconomic analysis.
Potential GDP vs. Effective GDP
A country’s potential is what it can be based on a handful of variables that go well beyond this text’s purpose. Let us bounce back to the 10-loaves-of-bread economy. We saw that in a five-year span the country grew its output potential from ten to fifteen loaves of bread. Given that it can now produce fifteen loaves of bread, it follows that if, for whichever and numerous reasons, the country produces fewer than that, it’ll be producing below its potential. If it puts out 12 loaves instead of 15, we’ll say that while its potential output can be 15, it effectively put out 12. It is underperforming!
The same reasoning applies to GDP. If, for instance, any given country’s GPD has on average been at a yearly growth rate of 4% , it’ll be underperforming if its GDP consistently and continually falls short of delivering those yearly 4%. Strictly assessed from this perspective, Brazil’s recent R-GDP growth rates shows crystal-clear evidence of underperformance because recent growth rates lag behind when stacked up against pre-crisis growth rate leves. Do you find that mind-boggling? Carry on reading.
Business Cycle Analysis

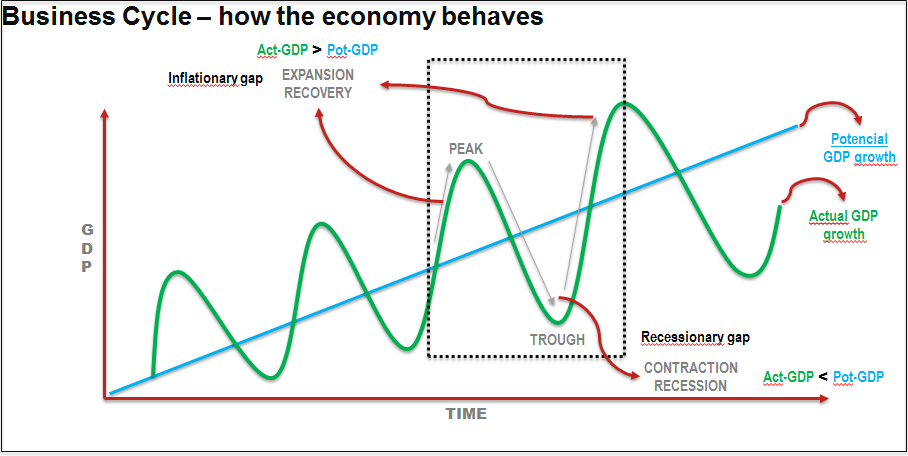
From all the graphs and equations I’ve come across throughout my college years (which as of this date haven’t finished), few have been so mind-opening. The Business Cycle graph is by far one of them. It depicts long-term economic growth and allows for a visual reading of an economy’s current stage within the business cycle.
The Y and X axes account for GDP growth over the long-term. The definitions of Potential vs. Effective GDP come in handy now. In an ideal scenario, GDP would have a linear and ascending growth pattern, represented by the blue line (i.e. potential GDP growth). Not surprisingly, however, the growth pattern that is generally observed over the long-run is represented by the green wavy line (i.e. actual/effective GDP growth). One has to keep in mind that it’s all theory. It does not depict the economy as it always is, but as it has historically been over the long-run.
The dotted square zooms in on a section of effective vs. potential GDP growth over time. What stands out, starting from left to right, are four stages, namely: (1) expansion, or recovery; (2) peak; (3) contraction, or recession; and (4) trough, followed then by expansion. Ideally, from an economic standpoint, a country’s policy-makers should aim at achieving sustainable potential GDP growth because it has historically been observed that when effective GDP distances itself too much upwards from potential GDP an inflationary gap comes about and, conversely, when effective GDP distances itself too much downwards from potential GDP a recessionary gap ensues.
The economic dynamics are cyclical, so ups and downs are not the exception , but, rather, the norm. Persistent and further-reaching fluctuations, though, are the exception of that norm and have consistently been fought back by policy-makers worldwide. That is so because in an inflationary gap scenario, resources — labour, capital, and land — are under pressure due to higher aggregate demand. In a recessionary gap scenario, much the opposite tends to happen: suppressed aggregate demand spurs mass layoffs, which slashes salaries and once more upsets demand. It seems that even in economics achieving a balance is the key. The Business Cycle analysis shows that keeping it means maintaining effective GDP the closest possible to potential GDP.
Having covered the definitions of Gross Domestic Product, its variants (Real vs. Nominal and Effective vs. Potential), as well as explained the Business Cycle theory, we are now prepared to assess Brazil’s current macroeconomic stage and even comment on the 2.20% GDP growth forecast for 2020.
Uphill momentum: Brazil’s current macroeconomic stage

Real GDP growth in 2017 signals the early stages of economic rebound. However, the 2017–18 growth rates (1.10% average) below the 2010–13 average of 4.10% outlines a sluggish recovery (see previous picture).
A week ago (last week of August), the Instituto Brasileiro de Geogragia e Estatistica (IBGE, the body in tasked with all that is to do with stats) released the GDP quarterly results (Q2) which brought in a growth at 0,4%. That is good news, for had Brazil showed negative growth in Q2 the country would officially have entered again in a technical recession which is when GDP falls for two consecutive quarters.
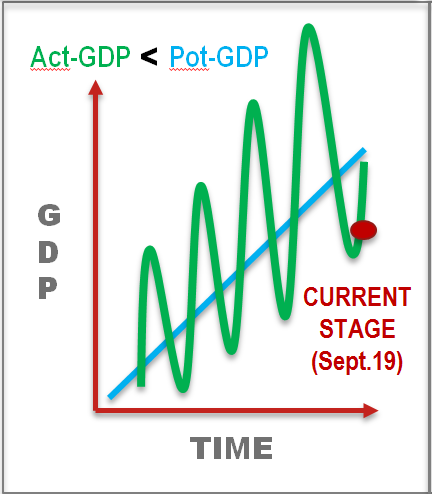
When we transport all this info onto the Business Cycle graph, it follows that the “end of fall” in GDP yearly rates in 2017 coupled with a current scenario where effective GDP is below potential GDP (Effect.-GDP < Pot.-GDP), plus 2019’s growth forecast of a mere 0.95%, the country’s current macroeconomic stage is clearly placed at the very beginning of an uphill ascending path (see picture above).
Is that good news? Having a half full glass is better than having a fully empty one, but not as good as having a fully filled glass. Similarly, it undoubtedly is good news that R-GDP has stopped falling as much as it had nosedived during the most acute years of the crisis, but it isn’t as great a piece of news to know that the glass is half full. We want it filled to the top (because that would mean that we’re the closest possible to our potential GDP), but not overspilling (because that would mean an inflationary gap).
Whether or not the projected growth for 2020, at 2.20%, will come about is a sensitive matter. I personally believe that 2.20% is naïvely optimistic. The incumbent government is aware, just was former ones, that key structural reforms are fundamental for a fully and faster-paced economic rebound. So far, circumstances suggest that the reforms will follow through. Internally, whether or not the reform agenda will really bring about much needed and deep changes is, by far, the one variable that poses the most threat to the timid recovery we have been witnessing.
On top of that, external factors also weigh in considerably. Regionally, Argentina’s upcoming (October 27th, 2019) presidential elections poses a threat if Peronism bounces back. The primaries, held in early August, suggest that very scenario. As Brazil’s third main trading partner, a comeback of an anti-market administration could worsen the economic turmoil which the country has faced and thus negatively impact Brazil’s exports to its neighbour. The USA-China trade war can also affect Brazil’s projected 2.20% forecast. If the conflict’s tit-for-tap escalates, the global economy may be impacted and that, in turn, has serious spillovers in emerging markets like Brazil.
To put it all in a nutshell: considering how sensitive the external scenario presents itself and how much Brazil’s reform agenda lingers on the fate of its volatile and corruption-ridden political caste, a 2.20% GDP growth forecast for 2020 is all, but sound. As an aspiring economist with yet tonnes to learn, I would bet that, all things considered, Brazil’s GDP growth rate would possibly fall within a 1 and 1.5% range. Definitively not above past the 2% range.


