O que é este blog?

Este blog trata basicamente de ideias, se possível inteligentes, para pessoas inteligentes. Ele também se ocupa de ideias aplicadas à política, em especial à política econômica. Ele constitui uma tentativa de manter um pensamento crítico e independente sobre livros, sobre questões culturais em geral, focando numa discussão bem informada sobre temas de relações internacionais e de política externa do Brasil. Para meus livros e ensaios ver o website: www.pralmeida.org. Para a maior parte de meus textos, ver minha página na plataforma Academia.edu, link: https://itamaraty.academia.edu/PauloRobertodeAlmeida;

Meu Twitter: https://twitter.com/PauloAlmeida53

Facebook: https://www.facebook.com/paulobooks

Mostrando postagens com marcador economic growth. Mostrar todas as postagens

quarta-feira, 16 de fevereiro de 2022

A diretora-gerente do FMI ensina aos países como recuperar o crescimento econômico (não sei se vai dar certo) - Kristalina Georgieva (IMF Blog)

image


IMF Blog

Dear Colleague,

We just published a new blog—please find the full text below. 

Three Policy Priorities for a Robust Recovery

(Photo: ASIANDREAM/iStock by Getty Images)

By Kristalina Georgieva

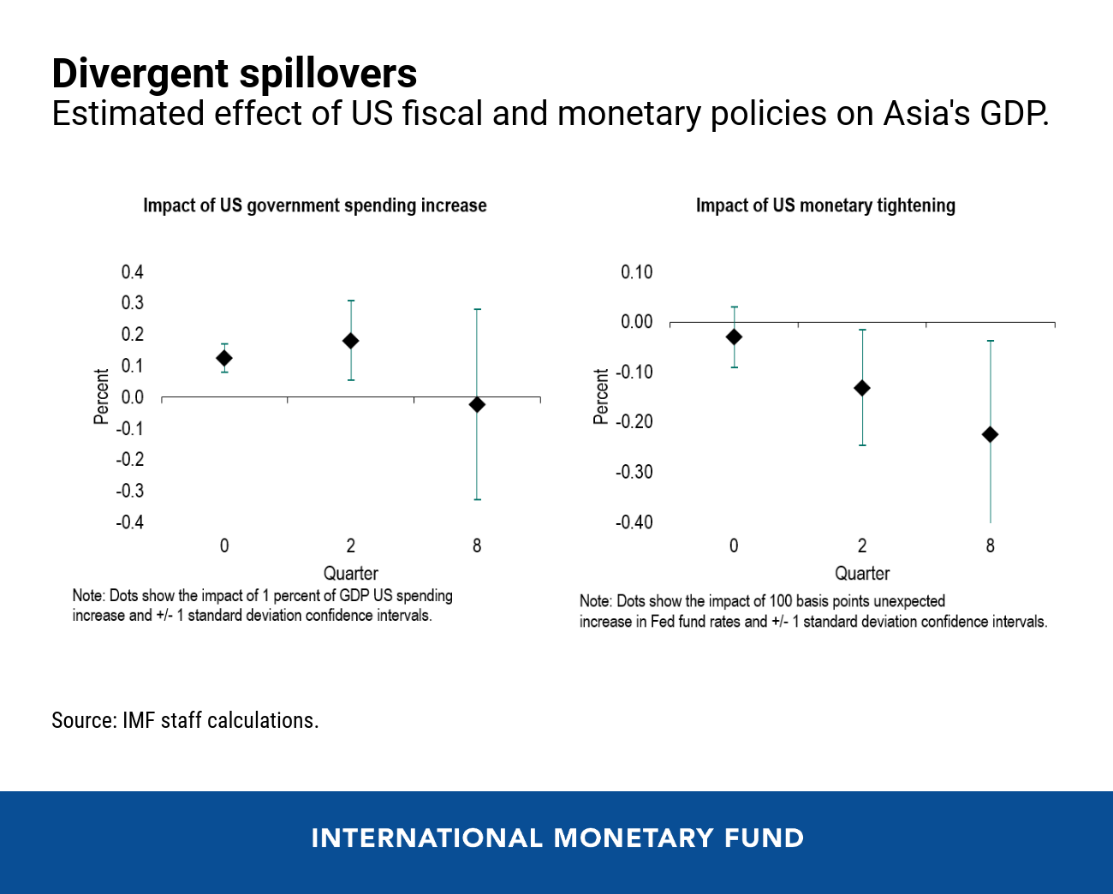
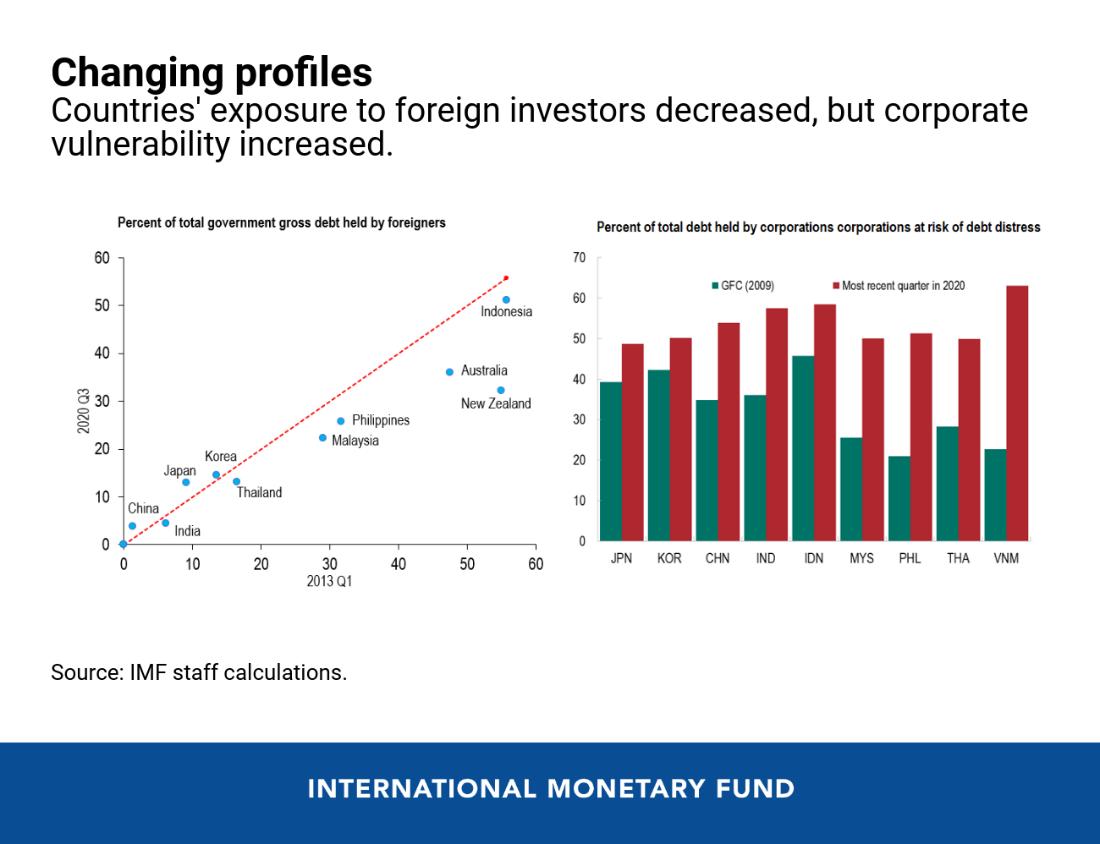
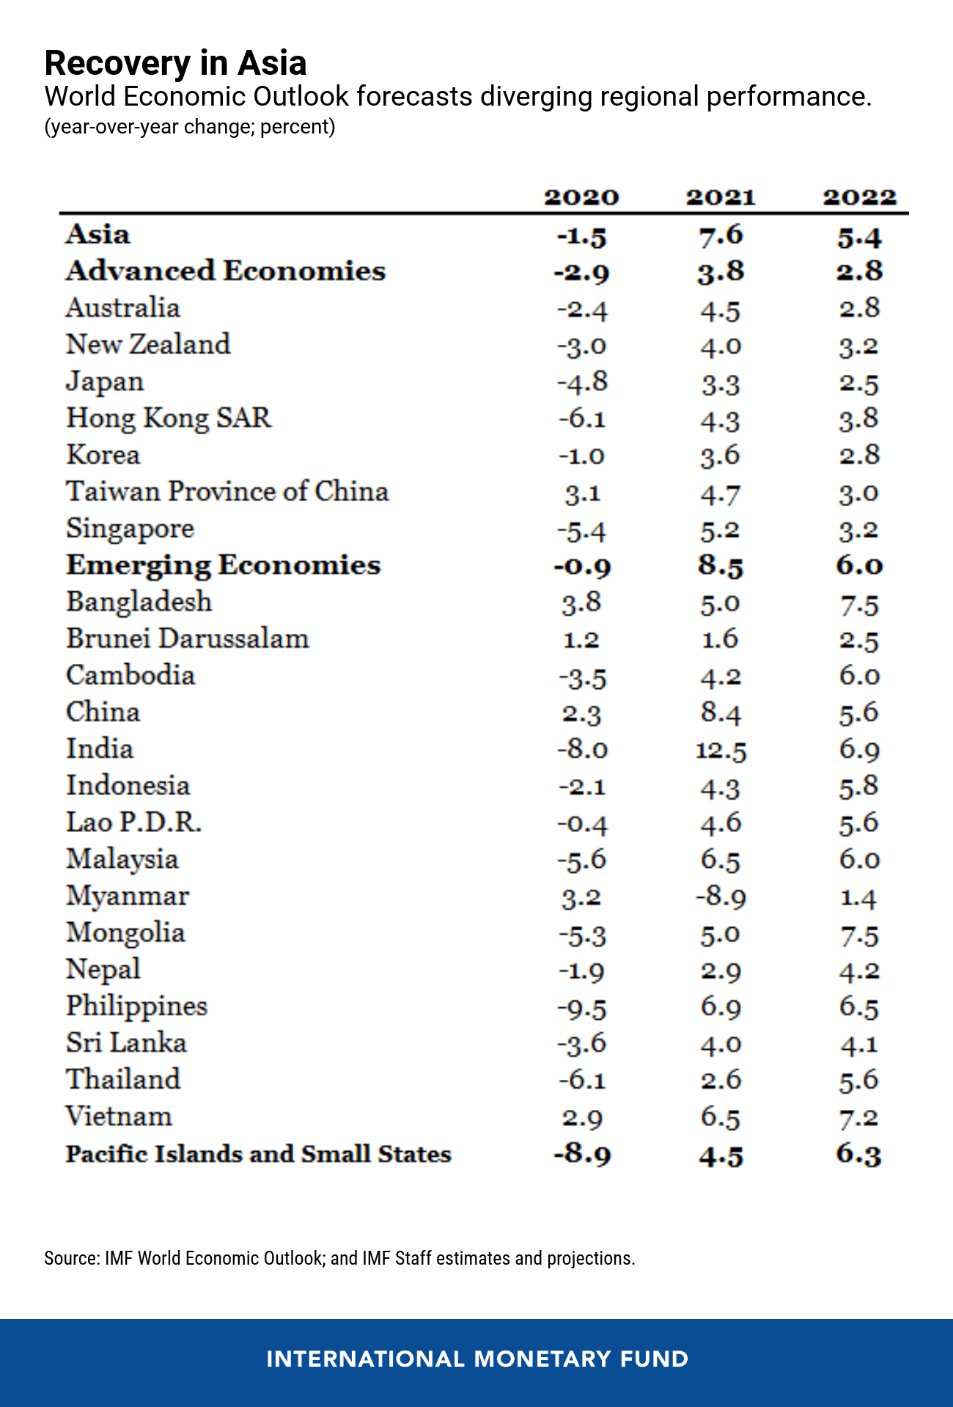
We must work together to end the pandemic, navigate monetary tightening and shift focus to fiscal sustainability.

When the Group of Twenty finance ministers and central bank governors gather in Jakarta, in person and virtually, this week, they can take inspiration from the Indonesian phrase, gotong royong, “working together to achieve a common goal. This spirit is more important than ever as countries are facing a tough obstacle course this year.

The good news is that the global economic recovery continues, but its pace has moderated amid high uncertainty and rising risks. Three weeks ago, we cut our global forecast to a still-healthy 4.4 percent for 2022, partly because of a reassessment of growth prospects in the United States and China.

Since then, economic indicators have continued to point to weaker growth momentum, due to the Omicron variant and persistent supply chain disruptions. Inflation readings have been higher than expected in many economies; financial markets remain volatile; and geopolitical tensions have sharply increased.

That is why we need strong international cooperation and extraordinary agility. For most countries, this means continuing to support growth and employment while keeping inflation under control and maintaining financial stability—all in the context of high debt levels.

Our new report to the G20 shows just how complex this obstacle course is and what policymakers can do to get through it. Let me highlight three priorities:

First, we need broader efforts to fight ‘economic long-Covid’

We project cumulative global output losses from the pandemic of nearly $13.8 trillion through 2024. Omicron is the latest reminder that a durable and inclusive recovery is impossible while the pandemic continues.

But considerable uncertainty remains about the path of the virus post-Omicron, including the durability of protection offered by vaccines or prior infections, and the risk of new variants.

In this environment, our best defense is to move from a singular focus on vaccines to ensuring each country has equitable access to a comprehensive COVID-19 toolkit with vaccines, tests, and treatments. Keeping these tools updated as the virus evolves will require ongoing investments in medical research, disease surveillance, and health systems that reach the “last mile” into every community.

Upfront financing of $23.4 billion to close the ACT-Accelerator funding gap will be an important down payment on distributing this dynamic toolkit everywhere. Going forward, enhanced coordination between G20 finance and health ministries is essential to increasing resilience—both to potential new SARS-CoV-2 variants, and future pandemics that could pose systemic risks.

Ending the pandemic will also help address the scars from economic long-COVID. Think of the profound disruptions in many businesses and labor markets. And think of the cost to students worldwide, estimated at up to $17 trillion over their lives due to learning losses, lower productivity, and employment disruptions.

School closures have been especially acute for students in emerging economies where educational attainment was much lower to begin with—threatening to compound the dangerous divergence among countries.

chart1

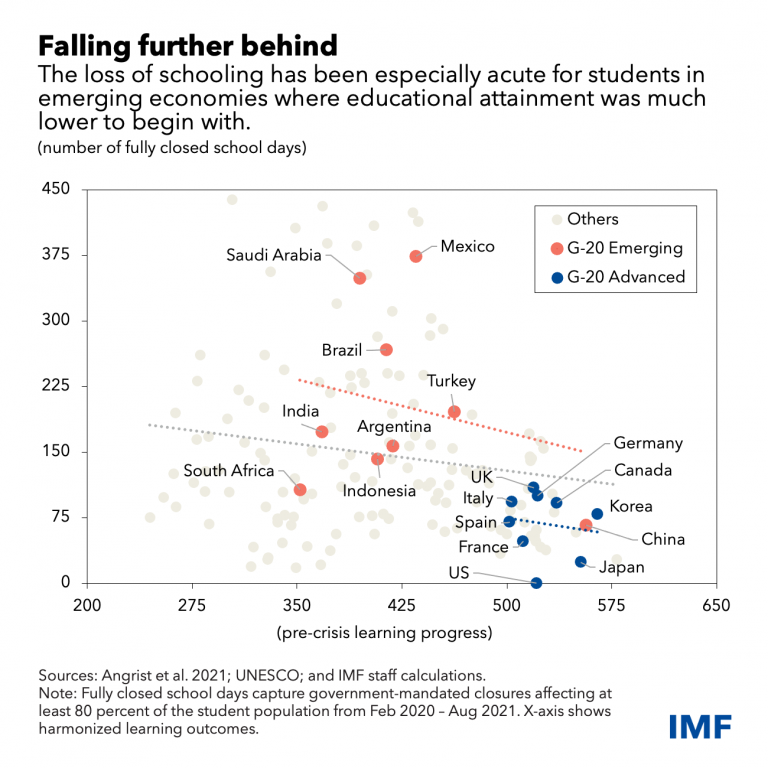
What can be done? Strong policy action. Scaling up social spending, reskilling programs, remedial training for teachers and tutoring for students will help economies get back on track and build resilience to future health and economic challenges.

Second, countries need to navigate the monetary tightening cycle

While there is significant differentiation across economies and high uncertainty going forward, inflation pressures have been building in many countries, calling for a withdrawal of monetary accommodation where necessary.

Going forward, it is important to calibrate policies to country circumstances. It means withdrawal of monetary accommodation in countries such as the United States and the United Kingdom, where labor markets are tight and inflation expectations are rising. Others, including the euro area, can afford to act more slowly, especially if the rise in inflation relates largely to energy prices. But they, too, should be ready to act if economic data warrants a faster policy pivot.

Of course, clear communication of any shift remains essential to safeguard financial stability at home and abroad. Some emerging and developing economies have already been forced to combat inflation by raising interest rates. And the policy pivot in advanced economies may require additional tightening across a wider range of nations. This would sharpen the already difficult trade-off countries face in taming inflation while supporting growth and employment.

So far, global financial conditions have remained relatively favorable, partly because of negative real interest rates in most G20 countries. But if these financial conditions tighten suddenly, emerging and developing countries must be ready for potential capital flow reversals.

chart2

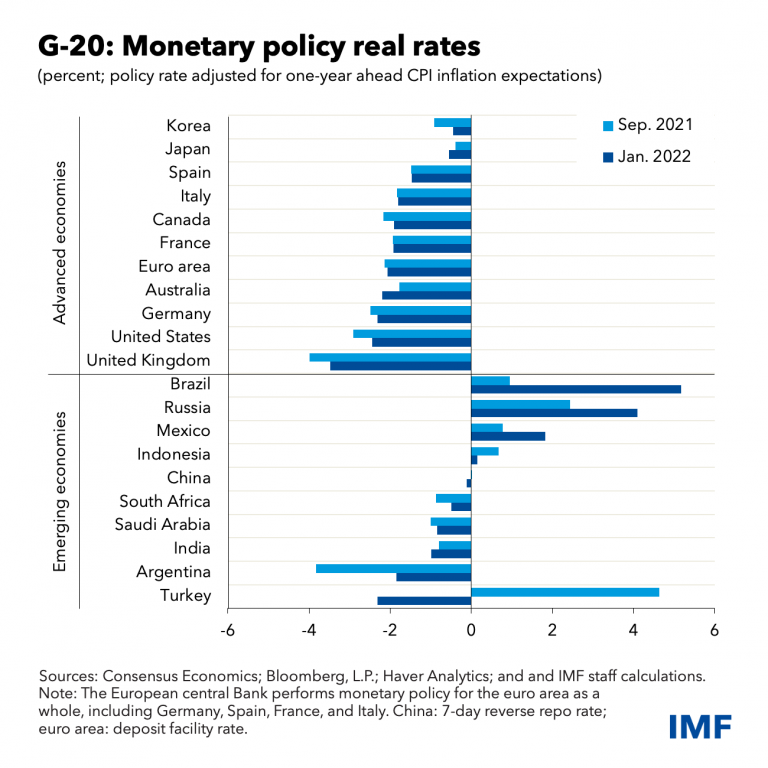
To prepare for this, borrowers should extend debt maturities where feasible now , while containing a further buildup of foreign currency debts. When shocks do come, flexible exchange rates are important for absorbing them, in most cases, but they are not the only tool available.

In the event of high volatility, foreign exchange interventions may be appropriate, as Indonesia successfully did in 2020. Capital flow management measures may also be sensible in times of economic or financial crisis: think of Iceland in 2008 and Cyprus in 2013. And countries can take macroprudential measures to guard against risks in the non-bank financial sector or where property markets are surging. Of course, all these measures may still need to be combined with macroeconomic adjustments.

In other words, we need to ensure that all countries can move safely through the monetary tightening cycle.

Third, countries need to shift their focus to fiscal sustainability

As countries emerge from the grip of the pandemic, they need to carefully calibrate their fiscal policies. It’s easy to see why: extraordinary fiscal measures helped prevent another Great Depression, but they have also pushed up debt levels. In 2020, we observed the largest one-year debt surge since the second world war, with global debt—both public and private—rising to $226 trillion.

For many countries, this means ensuring continued support for health systems and the most vulnerable, while reducing deficits and debt levels to meet their specific needs. For example, a faster scaling back of fiscal support is warranted in countries where the recovery is further ahead. This in turn will facilitate their shift in monetary policy by reducing demand and thus helping to contain inflationary pressures.

Others, especially in the developing world, face far more difficult trade-offs. Their fiscal firepower has been scarce throughout the crisis, which has left them with weaker recoveries and deeper scars from economic long-Covid. And they have little scope to prepare for a post-pandemic economy that is greener and more digital.

For example, the IMF last year described how green supply policies, including a 10-year public investment program, could raise annual global output by about 2 percent compared to the baseline on average over 2021-30.

All these policy actions can help us find new modus vivendi for a more shock-prone world. But they may be hampered by debt. We estimate that about 60 percent of low-income countries are in or at high risk of debt distress, double 2015 levels. These and many other economies will need more domestic revenue mobilization, more grants and concessional financing, and more help to deal with debt immediately.

That includes reinvigorating the G-20 Common Framework for debt treatment. This should start with offering a standstill on debt service payments during the negotiation under the framework. Quicker and more efficient processes are needed, with clarity on the steps to go through, so that everyone knows the road ahead—from formation of creditor committees to an agreement on debt resolution. And make the framework available to a wider range of highly indebted countries.

The IMF’s role

The IMF plays an important role in this area by providing macroeconomic frameworks and debt sustainability analyses. And we encourage greater debt transparency: by requesting greater disclosure of what a member country owes and to whom when it seeks IMF financing, and by working with our members through the IMF-World Bank Multi-Pronged Approach to debt vulnerability.

We also need to build on the historic allocation of Special Drawing Rights of $650 billion. As well as holding the new SDRs as reserves, some members have already begun to put them to good use. For example: Nepal for vaccine imports; North Macedonia for health spending and pandemic lifelines; and Senegal to boost vaccine production capacity.

To magnify the impact of the allocation, we encourage channeling of new SDRs through our Poverty Reduction and Growth Trust, which provides concessional financing to low-income countries, and the new Resilience and Sustainability Trust.

With its cheaper rates and longer maturities, the RST could fund climate, pandemic preparedness, and digitalization policies that would improve macroeconomic stability for decades to come. The G20 has given its strong backing to the RST, and we aim to have it fully operational this year.

As countries face up to multiple challenges, the IMF will support them with calibrated policy advice, capacity development, and financial assistance where needed. The key is to bring agility into all aspects of policymaking—but even that is not enough.

We also need to follow the spirit of Indonesia’s motto, Bhinneka Tunggal Ika—”Unity in Diversity.” Together we can get through the obstacle course to a durable recovery that works for all.

quarta-feira, 14 de abril de 2021

After a Strong Crisis Response, Asia Can Build a Fairer and Greener Future - Jonathan D. Ostry (IMF)

A Ásia continua crescendo, em meio à pandemia... 


After a Strong Crisis Response, Asia Can Build a Fairer and Greener Future

By Jonathan D. Ostry 

In some Asia-Pacific countries, the unpleasant memory of the pandemic is receding; elsewhere, second or third waves of infections are raging. A recovery is underway, but the regional averages obscure wide differences within and across countries.

Everywhere, the pandemic has inflicted historic income losses borne mostly by the less advantaged: low-wage and informal workers, as well as youth and women. A region known for its trademark growth-with-equity model now runs the risk of entrenching excessive inequality. If policymakers do not act, they risk stunted opportunities, fragile growth, and even social unrest.

Divergence Rules

Overall, exports and manufacturing have benefited from surging global demand for pandemic-related supplies. But economies more dependent on services are mostly languishing. We project regional growth to rebound to 7.6 percent this year and 5.4 percent next year.

Advanced economies (Australia, Japan, Korea) are benefiting from positive growth surprises late last year, strong policy responses, and spillovers from the large US fiscal package.

Some emerging markets, notably Indonesia, Malaysia, and the Philippines, are contending with increased coronavirus cases and renewed lockdowns, and therefore face a weaker recovery.

Growth in China and India has been revised up. For China, the markup to 8.4 percent this year reflects stronger net exports and the US fiscal stimulus, while the revision to 12.5 percent for India is driven by continued normalization of its economy and a more growth-friendly fiscal policy, even as the number of active cases has ticked up sharply in recent weeks.

Pacific Islands and other small states have been hit hard by the collapse in tourism and the sharp contraction in demand for commodities.

Disease variants looming

Wherever populations have received rapid and broad vaccine rollouts, health conditions have improved and propelled stronger recoveries. But the emergence of new variants and waves of infection, and questions about vaccine efficacy, remind us that the health crisis is far from over and that there is huge uncertainty surrounding the outlook.

The changing external environment is a central driver of risk in the region, given Asia’s outward orientation to trade and capital flows. The combination of expansionary fiscal policy in the United States with the marked increase in US 10-year government bond yields is reverberating in the region. Our analysis highlights important spillovers for Asian economies.

  • Asia is likely to experience favorable spillovers through trade channels as US fiscal expansion boosts growth and imports—that’s the good news for the region.
  • But if US yields rise faster than markets expect, or if there is miscommunication about future US monetary policy, adverse spillovers through financial channels and capital outflows, as during the 2013 taper tantrum, could compromise macro-financial stability.


chart 1


The consequences will thus vary according to country-specific trade and financial linkages. The share of foreign holdings of Asia’s government debt has diminished in recent years, reducing exposure to nonresident investors. In addition, greater official reserve holdings, more flexible exchange rates, stronger supervision over bank balance sheets, and better anchored inflationary expectations should dampen the impact of any faltering in foreign investors’ risk appetite.

However, the increase in debt across government, household, and corporate balance sheets means that higher borrowing costs—when they come—will hurt. Managing the risks and laying the foundation for a sustainable inclusive post-pandemic recovery requires deft policies today.

chart 2


Agenda for the post-pandemic 

Ensuring that vaccines are widely available in all countries remains the first priority. Boosting supply and administration capacity is essential, and international cooperation is needed to ensure universal distribution at affordable prices.

Fiscal support, targeted to those in need, should remain in place until the pandemic is behind us and private demand recovers. Broad lifelines should be phased out only gradually as the pandemic recedes and future support should then be geared to achieve needed reallocation of resources toward new dynamic (green and digital) sectors. Even now, policymakers need to be attentive to anchoring public debt in credible medium-term frameworks, especially where fiscal space and buffers have been eroded.

Monetary policy should continue to be data-dependent and attendant to macroeconomic and financial-stability risks. The challenges going forward may be significant given the possibility of renewed bouts of capital outflows, and risks from inflated house prices in some countries. Policy makers will have to rely on monetary policy and other instruments to safeguard macro-financial stability in this challenging environment.

But stability is only one objective. Growth productivity and the size of the pie, and giving all citizens a fair shot at this growing pie are equally important. Policy makers must recommit to a greener and more inclusive recovery that ensures equality of opportunity in Asia’s growing and more sustainable economy.  

Trade has historically been an engine of growth in this region, boosting incomes and living standards and lifting millions out of poverty. Since the mid-1990s, however, the pace of trade liberalization has stalled and too many tariffs and non-tariff barriers are in place. Broad liberalization would deliver sizeable output gains in the medium term and help to offset the scars from the current crisis.

Corporate debt, already high before, has increased further with the pandemic, despite exceptional fiscal and monetary policy support. Corporate sector policies must now pivot from liquidity to solvency support: streamlining insolvency procedures; maintaining credit to allow viable firms to recover; and facilitating fresh equity capital to help firms reduce debt and grow.

The Asian recovery stands out because of prompt and effective policies during pandemic’s acute phase. The next phase is even more challenging: to lay the foundation for a more inclusive, greener, and resilient region.

chart 3


Jonathan D. Ostry is Acting Director of the Asia and Pacific Department at the International Monetary Fund.

*****

We want to hear from you! Click here for a 3-question survey on IMFBlog.


Thank you again for your interest in IMF Blog. Read more of our latest content here.

Take good care,

Glenn


Glenn Gottselig
Blog Editor, IMF
GGottselig@IMF.org

quinta-feira, 9 de janeiro de 2020

Economic Growth By Robert J. Barro and Xavier I. Sala-i-Martin: Introduction

Sempre recomendo este livro aos meus alunos: o melhor text-book, tanto no plano teórico, como no terreno histórico-empírico.

Economic Growth

Second edition

Hardcover

$110.00 £90.00ISBN: 9780262025539672 pp. | 7 in x 9 in
The long-awaited second edition of an important textbook on economic growth—a major revision incorporating the most recent work on the subject.

Summary

The long-awaited second edition of an important textbook on economic growth—a major revision incorporating the most recent work on the subject.
This graduate level text on economic growth surveys neoclassical and more recent growth theories, stressing their empirical implications and the relation of theory to data and evidence. The authors have undertaken a major revision for the long-awaited second edition of this widely used text, the first modern textbook devoted to growth theory. The book has been expanded in many areas and incorporates the latest research. After an introductory discussion of economic growth, the book examines neoclassical growth theories, from Solow-Swan in the 1950s and Cass-Koopmans in the 1960s to more recent refinements; this is followed by a discussion of extensions to the model, with expanded treatment in this edition of heterogenity of households. The book then turns to endogenous growth theory, discussing, among other topics, models of endogenous technological progress (with an expanded discussion in this edition of the role of outside competition in the growth process), technological diffusion, and an endogenous determination of labor supply and population. The authors then explain the essentials of growth accounting and apply this framework to endogenous growth models. The final chapters cover empirical analysis of regions and empirical evidence on economic growth for a broad panel of countries from 1960 to 2000. The updated treatment of cross-country growth regressions for this edition uses the new Summers-Heston data set on world income distribution compiled through 2000.
Introduction 
I.
The Importance of Growth To think about the importance of economic growth, we begin by assessing the long-term performance of the U.S. economy. The real per capita gross domestic product (GDP) in the United States grew by a factor of 10 from $3340 in 1870 to $33,330 in 2000, all measured in 1996 dollars. This increase in per capita GDP corresponds to a growth rate of 1.8 percent per year. This performance gave the United States the second-highest level of per capita GDP in the world in 2000 (after Luxembourg, a country with a population of only about 400,000).
To appreciate the consequences of apparently small differentials in growth rates when compounded over long periods of time, we can calculate where the United States would have been in 2000 if it had grown since 1870 at 0.8 percent per year, one percentage point per year below its actual rate. A growth rate of 0.8 percent per year is close to the rate experienced in the long run—from 1900 to 1987—by India (0.64 percent per year), Pakistan (0.88 percent per year), and the Philippines (0.86 percent per year). If the United States had begun in 1870 at a real per capita GDP of $3340 and had then grown at 0.8 percent per year over the next 130 years, its per capita GDP in 2000 would have been $9450, only 2.8 times the value in 1870 and 28 percent of the actual value in 2000 of $33,330. 
Then, instead of ranking second in the world in 2000, the United States would have ranked 45th out of 150 countries with data. To put it another way, if the growth rate had been lower by just 1 percentage point per year, the U.S. per capita GDP in 2000 would have been close to that in Mexico and Poland. Suppose, alternatively, that the U.S. real per capita GDP had grown since 1870 at 2.8 percent per year, 1 percentage point per year greater than the actual value. This higher growth rate is close to those experienced in the long run by Japan (2.95 percent per year from 1890 to 1990) and Taiwan (2.75 percent per year from 1900 to 1987). If the United States had still begun in 1870 at a per capita GDP of $3340 and had then grown at 2.8 percent per year over the next 130 years, its per capita GDP in 2000 would have been $127,000— 38 times the value in 1870 and 3.8 times the actual value in 2000 of $33,330. 
A per capita GDP of $127,000 is well outside the historical experience of any country and may, in fact, be infeasible (although people in 1870 probably would have thought the same about $33,330). We can say, however, that a continuation of the long-term U.S. growth rate of 1.8 percent per year implies that the United States will not attain a per capita GDP of $127,000 until 2074.
Ler toda a Introdução neste link.

domingo, 8 de setembro de 2019

Brazil’s current macroeconomic stage - Adilson Santos de Proença (Medium)

By the end of the 2017–2018 period Brazil’s Effective Gross Domestic Product (to be defined later on the text), on an average yearly basis, had not fared better than it had during the pre-crisis years, 2010–2013. That is: while the quadrennium that preceded the 2015–2016 downturn (when Real GDP plummeted 6.8%) witnessed, on an average yearly basis, growth rates of 4.10%, the ensuing rebound starting in 2017, albeit sluggish, has brought in an average yearly Real GDP growth of 1.10%.
From a macroeconomic standpoint, thus, a reading the currently available statistics suggests a timid, underperforming, slow-paced recovery. Nonetheless, optimism remains high as some economists even forecast a 2020 GDP spike of +2,20% compared to this year (2019)mere 0,95%. Having said that, just how seriously can a +2% expected growth be taken, considering Brazil’s — and the world’s — current state of affairs? Let us talk some basic economics.

GDP vsReal GDP vs. Nominal GDP

First off, some elementary definitions. Gross Domestic Product (GDP) is a macroeconomic measure of a country’s total output. It’ll tell you the market value of all final goods and services produced within a defined (generally a year) period of time. GDP can be either measured nominally or in real terms. What that means is that a nominal GDP (N-GDP) measures output at current prices while Real-GDP (R-GDP) assesses output from a base-year price.
For macroeconomic purposes, R-GDP is generally preferred over the nominal one because it factors out inflation. As it does so, R-GDP thus provides the reader with a real sense of output without the distortions caused by price fluctuations.
Let me offer you an example. In 2010 a hypothetical country produced ten loaves of bread. It was all sold at a market price of US$ 1,00/a loaf. It follows, then, that this country’s GDP is US$ 10,00. Time lapses and 2015 kicks in. For numerous reasons, the price per loaf of bread rises to US$ 2,00. The economy is now capable of producing fifteen loaves of bread. Assuming it was all sold, it follows that now GDP is US$ 30,00. It won’t take a wonk to tell that GDP has doubled, but has it really?
While production increased 5% (from 10 to 15 loaves of bread), GDP boasts a 200% increase at current (2015) prices! That’s nominal GDP. On the other hand, however, counting in at a base-year price will show us how much GDP would be today at a given past year’s prices, that is: inflation factored out. Then, 2015’s production of fifteen loaves of bread at 2010’s prices puts out a GDP, discounted for inflation, of US$ 15,00. A 50% difference that shows us how much output, not prices, has really grown. That’s Real GDP.
Having stated those differences, let us appreciate some real stats:
The author’s rudimentary power point skills with data from Business Monitor International (BMI)
What you see is Brazil’s R-GDP over the past eight years (2010–2018) plus two forecasts: the current year’s (2019), and the upcoming one (2020). A closer reading of the numbers sheds light on the fact that, on an average yearly basis (and as stated earlier), the rebound started in 2017 plus 2018’s accumulated growth is well below the average yearly growth seen during the pre-crisis years. What that effectively tells us is that Brazil is faring less well than it potentially could. Comparing what a GDP can potentially be and what it effectively is is another paramount lens in macroeconomic analysis.
Potential GDP vs. Effective GDP
A country’s potential is what it can be based on a handful of variables that go well beyond this text’s purpose. Let us bounce back to the 10-loaves-of-bread economy. We saw that in a five-year span the country grew its output potential from ten to fifteen loaves of bread. Given that it can now produce fifteen loaves of bread, it follows that if, for whichever and numerous reasons, the country produces fewer than that, it’ll be producing below its potential. If it puts out 12 loaves instead of 15, we’ll say that while its potential output can be 15, it effectively put out 12. It is underperforming!
The same reasoning applies to GDP. If, for instance, any given country’s GPD has on average been at a yearly growth rate of 4% , it’ll be underperforming if its GDP consistently and continually falls short of delivering those yearly 4%. Strictly assessed from this perspective, Brazil’s recent R-GDP growth rates shows crystal-clear evidence of underperformance because recent growth rates lag behind when stacked up against pre-crisis growth rate leves. Do you find that mind-boggling? Carry on reading.
Business Cycle Analysis
The author’s rudimentary power point skills once more
From all the graphs and equations I’ve come across throughout my college years (which as of this date haven’t finished), few have been so mind-opening. The Business Cycle graph is by far one of them. It depicts long-term economic growth and allows for a visual reading of an economy’s current stage within the business cycle.
The Y and X axes account for GDP growth over the long-term. The definitions of Potential vs. Effective GDP come in handy now. In an ideal scenario, GDP would have a linear and ascending growth pattern, represented by the blue line (i.e. potential GDP growth). Not surprisingly, however, the growth pattern that is generally observed over the long-run is represented by the green wavy line (i.e. actual/effective GDP growth). One has to keep in mind that it’s all theory. It does not depict the economy as it always is, but as it has historically been over the long-run.
The dotted square zooms in on a section of effective vs. potential GDP growth over time. What stands out, starting from left to right, are four stages, namely: (1) expansion, or recovery; (2) peak; (3) contraction, or recession; and (4) trough, followed then by expansion. Ideally, from an economic standpoint, a country’s policy-makers should aim at achieving sustainable potential GDP growth because it has historically been observed that when effective GDP distances itself too much upwards from potential GDP an inflationary gap comes about and, conversely, when effective GDP distances itself too much downwards from potential GDP a recessionary gap ensues.
The economic dynamics are cyclical, so ups and downs are not the exception , but, rather, the norm. Persistent and further-reaching fluctuations, though, are the exception of that norm and have consistently been fought back by policy-makers worldwide. That is so because in an inflationary gap scenario, resources — labour, capital, and land — are under pressure due to higher aggregate demand. In a recessionary gap scenario, much the opposite tends to happen: suppressed aggregate demand spurs mass layoffs, which slashes salaries and once more upsets demand. It seems that even in economics achieving a balance is the key. The Business Cycle analysis shows that keeping it means maintaining effective GDP the closest possible to potential GDP.
Having covered the definitions of Gross Domestic Product, its variants (Real vs. Nominal and Effective vs. Potential), as well as explained the Business Cycle theory, we are now prepared to assess Brazil’s current macroeconomic stage and even comment on the 2.20% GDP growth forecast for 2020.
Uphill momentum: Brazil’s current macroeconomic stage
Myself, again.
Real GDP growth in 2017 signals the early stages of economic rebound. However, the 2017–18 growth rates (1.10% average) below the 2010–13 average of 4.10% outlines a sluggish recovery (see previous picture).
A week ago (last week of August), the Instituto Brasileiro de Geogragia e Estatistica (IBGE, the body in tasked with all that is to do with stats) released the GDP quarterly results (Q2) which brought in a growth at 0,4%. That is good news, for had Brazil showed negative growth in Q2 the country would officially have entered again in a technical recession which is when GDP falls for two consecutive quarters.
When we transport all this info onto the Business Cycle graph, it follows that the “end of fall” in GDP yearly rates in 2017 coupled with a current scenario where effective GDP is below potential GDP (Effect.-GDP < Pot.-GDP), plus 2019’s growth forecast of a mere 0.95%, the country’s current macroeconomic stage is clearly placed at the very beginning of an uphill ascending path (see picture above).
Is that good news? Having a half full glass is better than having a fully empty one, but not as good as having a fully filled glass. Similarly, it undoubtedly is good news that R-GDP has stopped falling as much as it had nosedived during the most acute years of the crisis, but it isn’t as great a piece of news to know that the glass is half full. We want it filled to the top (because that would mean that we’re the closest possible to our potential GDP), but not overspilling (because that would mean an inflationary gap).
Whether or not the projected growth for 2020, at 2.20%, will come about is a sensitive matter. I personally believe that 2.20% is naïvely optimistic. The incumbent government is aware, just was former ones, that key structural reforms are fundamental for a fully and faster-paced economic rebound. So far, circumstances suggest that the reforms will follow through. Internally, whether or not the reform agenda will really bring about much needed and deep changes is, by far, the one variable that poses the most threat to the timid recovery we have been witnessing.
On top of that, external factors also weigh in considerably. Regionally, Argentina’s upcoming (October 27th, 2019) presidential elections poses a threat if Peronism bounces back. The primaries, held in early August, suggest that very scenario. As Brazil’s third main trading partner, a comeback of an anti-market administration could worsen the economic turmoil which the country has faced and thus negatively impact Brazil’s exports to its neighbour. The USA-China trade war can also affect Brazil’s projected 2.20% forecast. If the conflict’s tit-for-tap escalates, the global economy may be impacted and that, in turn, has serious spillovers in emerging markets like Brazil.
To put it all in a nutshell: considering how sensitive the external scenario presents itself and how much Brazil’s reform agenda lingers on the fate of its volatile and corruption-ridden political caste, a 2.20% GDP growth forecast for 2020 is all, but sound. As an aspiring economist with yet tonnes to learn, I would bet that, all things considered, Brazil’s GDP growth rate would possibly fall within a 1 and 1.5% range. Definitively not above past the 2% range.

quarta-feira, 1 de novembro de 2017

A Culture of Growth: The Origins of the Modern Economy - Joel Mokyr

Published by EH.Net (November 2017)
Joel Mokyr, A Culture of Growth: The Origins of the Modern Economy. Princeton, NJ: Princeton University Press, 2017. xiv + 403 pp. $35 (cloth), ISBN: 978-0-691-16888-3.
Reviewed for EH.Net by Claude Diebolt, Department of Economics, University of Strasbourg.
 I enjoyed this new book by Joel Mokyr, which is praiseworthy for its elegance and erudition. It tells the story of economic growth with “culture” — a mushy word for most of us — as the invisible hand. However, I regret the lack of in-depth consideration of the German language literature. Significantly more attention could also have been given to economic cycles. Werner Sombart, for example (Der moderne Kapitalismus and Der Bourgeois. Zur Geistesgeschichte des modernen Wirtschaftsmenschen), was the first to come to mind while reading this fantastic book. It also reminds me of George Akerlof and Robert Schiller’s Animal Spirits, where confidence, fear, a propensity to gamble, and follow-the-leader effect stories are presented as central to explain the decision making process. The Bourgeois Trilogy by Deirdre McCloskey is another seminal work in that spirit: ideas, not capital or institutions enriched the world. A growth theorist would probably also see strong connections between Mokyr’s latest effort and the unified growth theory initiated by Oded Galor.

The book is about the roots of the Industrial Revolution, the Great Enrichment, and radical changes in values, beliefs, and preferences. It is not about a mass movement. It is a phenomenon related to an elite: philosophers and scientists of course, but also engineers, instrument makers, and even industrialists who spawned the process. In any case, it is a minority of the population. Mokyr’s ambition is to understand and to explain how these beliefs and values emerged — why some people developed new ideas and why these ideas replaced the ones in place.
According to Mokyr, we know pretty much what happened, how it happened and where it happened, but we still do not know why it happened. Why, after thousands of years of stagnation, have a number of countries and regions of the world experienced an unprecedented increase in both the scale and speed of their economic growth? Why Europe and not China? Why England? Is it the result of happenstance? The Black Death perhaps? What about the influence of religion (Max Weber and the Protestant ethic?), of major intellectual and scientific personalities who changed the game (Martin Luther, Francis Bacon, Isaac Newton, Adam Smith, Charles Darwin)? What role should be given to natural resource saturation, innovation (the compass, gunpowder, printing) and capital accumulation, trade networks, market institutions and organizations, ideas, violence (battles, dynastic arrangements, power struggles…), women, etc.? For Mokyr, the Gordian knot is a Culture of Growth — a \”Useful knowledge,\” scientific and technological knowledge, the meeting of motivations and incentives, of attitudes and aptitudes toward Nature and the ability to persuade others. These are the key elements of the puzzle.
“No theory-no history! Theory is the pre-requisite to any scientific writing of history,” wrote Werner Sombart (1929) in the Economic History Review. I urge you to carefully read Joel Mokyr’s evolutionary approach to culture in the spirit of Schumpeter’s theory on Unternehmergeist. It will give you a fresh insight into one of the most fascinating questions in our field: the origins of the Great Enrichment. It will invite everyone to visit economic history with an optimistic vision for the future of the World!

Claude Diebolt is CNRS Research Professor of Economics at the University of Strasbourg and editor of the journal Cliometrica.
Copyright (c) 2017 by EH.Net. All rights reserved. This work may be copied for non-profit educational uses if proper credit is given to the author and the list. For other permission, please contact the EH.Net Administrator (administrator@eh.net). Published by EH.Net (November 2017). All EH.Net reviews are archived at http://www.eh.net/BookReview.