O que é este blog?

Este blog trata basicamente de ideias, se possível inteligentes, para pessoas inteligentes. Ele também se ocupa de ideias aplicadas à política, em especial à política econômica. Ele constitui uma tentativa de manter um pensamento crítico e independente sobre livros, sobre questões culturais em geral, focando numa discussão bem informada sobre temas de relações internacionais e de política externa do Brasil. Para meus livros e ensaios ver o website: www.pralmeida.org. Para a maior parte de meus textos, ver minha página na plataforma Academia.edu, link: https://itamaraty.academia.edu/PauloRobertodeAlmeida;

Meu Twitter: https://twitter.com/PauloAlmeida53

Facebook: https://www.facebook.com/paulobooks

Mostrando postagens com marcador world economic forum. Mostrar todas as postagens

terça-feira, 23 de outubro de 2018

Brasil: indice mediocre de competitividade - Forum de Davos

Brasil assume lanterna dos BRICS em índice de competitividade global

Publicado anualmente pelo Fórum Econômico Mundial, o chamado "Relatório Global de Competitividade" trouxe o Brasil três posições abaixo no comparativo com o ano passado. Ranking apresenta China em 28º, Rússia em 43º, Índia em 58º e África do Sul em 67º lugar. Brasil é apenas o 72º na lista liderada por Estados Unidos, Cingapura, Alemanha e Suíça.

Agência (russa) Sputniks, 23/102018

documento analisa 140 nações e pondera fatores como instituições, infraestrutura, estabilidade macroeconômica, saúde, qualificação profissional, capital humano, dinamismo em ambiente de negócios e inovação. A lanterna geral é ocupada pelo Chade, Iêmen e Haiti, três países que passaram ou passam por conflitos bélicos recentemente.
Para o economista e professor da Fundação Dom Cabral, Gilberto Braga, se levados em consideração os indicadores ponderados pelo levantamento, a colocação do Brasil é justa. O especialista avalia que "burocracia administrativa elevada e a carga tributária alta" são os principais fatores que impedem o país de subir no ranking.
"Quando comparado com países desenvolvidos e os BRICS, o Brasil é aquele que é mais difere. Tem mais burocracia e não possui marco jurídico e regulatório fixo. Aqui se modificam as regras em uma velocidade muito grande, o empreendedor quando abre um negócio, ás vezes antes de começar funcionar vê que a regra já mudou. Não se trata de capacidade ou criatividade, mas de má condição para se fazer negócios quando comparado com outras nações", critica.
Braga aponta que o Brasil usa de 7 a 8 vezes mais funcionários em comparação com a Inglaterra apenas para atender a funções administrativas e governamentais. "No Brasil uma empresa costuma ocupar de 35 a 40% dos seus funcionários administrativos dedicados a trabalhos governamentais como preenchimento de guias, montam arquivos, transmitem informações para órgãos regulares, autoridades tributárias e governamentais", pontua.
Além de trâmites legais complicados, somam-se, na visão do economista, fatores de cunho social como a "má educação [da população], a violência urbana e a corrupção".
"Tudo isso faz com que o o investidor, sobretudo o estrangeiro, quando vai direcionar os empreendimentos para determinado país pondere esses fatores. Muitas vezes [o investimento] poderia ser no Brasil, por conta das nossas tradições e potencialidades, e acaba sendo dirigido para outra nação", diz.
No recorte dos BRICS, o ranking traz a China em 28º, Rússia em 43º, Índia em 58º e África do Sul em 67º lugar. O Brasil é apenas o 72º na lista liderada por Estados Unidos, Cingapura e Alemanha.

domingo, 18 de março de 2018

China: a grande ofensiva na America Latina - World Economic Forum

The challenges of Chinese investment in Latin America

The World Economic Forum, committed to improving the state of the world, is the International Organization for Public-Private Cooperation #wef
A fire dragon dance during Chinese Lunar New Year celebrations in Cotia, Brazil. Image: REUTERS/Paulo Whitaker
Lourdes Casanova, Senior Lecturer and Academic Director, Emerging Markets Institute, Johnson School of Management, Cornell University


As São Paulo hosts the World Economic Forum on Latin America 2018, it is time to consider China’s important influence on economies and business in the region since the Forum’s last meeting in Brazil, in 2011.
With foreign trade worth $4 trillion, China is the world’s most important trading country. Besides the US, it is also the most important trading partner for 100 countries, including Argentina, Brazil, Chile, Peru and Uruguay.
During South America’s golden decade from the early 2000s, the region welcomed China as a key enabler of its commodities super-cycle. Now, China has moved beyond trade to being a major investor, whose presence is felt in primary sectors such as mining, oil, construction, banking and utilities. As much as we all admire China’s tremendous economic progress, these changes have generated a number of issues to consider:

Speed and depth

In just 10 years, China has become a key trade partner and investor in the region. Its presence has been felt beyond trade. China has started using the renminbi in swaps worth $70 billion in Argentina, $27 billion in Brazil and, more recently, approximately $3 billion in Chile.
Since 2010, China has been a source of financing for the region, according to a study published by The Inter-American Dialogue in 2016. China loaned $65 billion to Venezuela in exchange for oil, $21 billion to Brazil and approximately $15 billion to both Argentina and Ecuador. Although certain sources claim that China favoured left-wing governments, it continued its loans to Argentina and Brazil after their respective governments changed. In fact, it is reconsidering its loans to Venezuela because of the country’s political chaos.
On the venture capital side, China has increased its investments to more than $1 billion in 2017, compared to only $30 million two years previously, according to the research firm Preqin.

Unidirectional investments

While Chinese investments are felt all over, Latin American investments in China are limited to a few companies, such as Brazilian firms Embraer and Vale, and the Mexican Grupo Bimbo. Although Asia receives the majority (66%) of Chinese investments, Latin America comes second, receiving 12%, followed by Europe (7%), the US (5%) and Africa (3.5%). Of Chinese investments in Latin America, Brazil received 55%. In 2013 there were 60 investment projects in Brazil led by 44 Chinese companies (Sinopec and State Grid are the leaders) worth a total of $68 billion, according to data from the Brazil-China economic council.

State versus private

The first wave of privatizations in Latin America started in Chile in 1987, with its telecommunications industry. The privatization of banking, electricity, highways and pension systems followed. Today, as Brazil and Mexico (primarily) are starting a second wave of privatization, it is a paradox that Chinese state-owned companies are buying privatized companies. In the latest move, China Mobile and China Telecom, both partially or totally state-owned, have expressed interest in buying the bankrupt Brazilian telecoms operator Oi.
Chinese investments have moved from primary resources to services, thanks — in part — to the Chinese state-owned utility State Grid, the second biggest company in the world by sales, after Wal-Mart. State Grid supplies electricity to 88% of Chinese territory. It is innovating by reducing the loss of energy in transmission — a key technology for large countries like China and Brazil.
The company entered Brazil in 2010 with the acquisition of seven companies from Spanish company ACS for $989 million. In 2014, State Grid led the IE Belo Monte Consortium, formed by State Grid Brasil Holding S.A. (holding 51%), Brazilian companies Furnas Central Eléctrica S.A. (holding 24.5%) and Eletronorte (holding 24.5 %).
For the first time, Western companies were not part of this consortium, which won the bid to build 2,100 kilometres of electrical grid, running from the hydroelectric power plant Belo Monte in the state of Pará to the southeast of Brazil, worth an estimated $1.5 billion.
In 2015, the electrical sector saw another major investment. China Three Gorges Corp. (CTG) bought the hydroelectric plant Jupiá e Ilha Solteira Brazil Energy for $3.6 billion. Other important investments have been made by Chinese oil companies CNOOC, CNPC and Sinopec, in partnership with Spanish companies Repsol and Petrogal. Together they won the bidding for the exploration of the pre-salt area of the Libra oil field. China has also been active in Brazil’s construction industry: CCCC is building a port in Maranhão.
China’s penetration into the economies of Brazil and the wider region has been rapid, and continues to be so. Much of this Chinese influence is being exercised by the increasing global expansion of Chinese firms, including by those state-owned. This is a paradox for Latin America, as its private, formerly state-owned companies are becoming state-owned companies in another country.
Latin America now needs both to partner and compete with China, a country in which the public and private sectors work in unison, in which the line between public and private is blurred, and in which industrial policies and long-term planning take priority over the short-term.
This is a change of paradigm for a region used to dealing with relatively well-known American and European companies that had been operating in Latin America for a long time. Finding an answer to these challenges will be key to making Latin America and China’s new relationship a win-win for both sides.
Have you read?


Originally published at www.weforum.org.

sábado, 10 de março de 2018

Como a India avançou mais do que a China (relativamente) - World Economic Forum

A matéria é antiga, mas continua relevante...

Here’s how India became more competitive than China

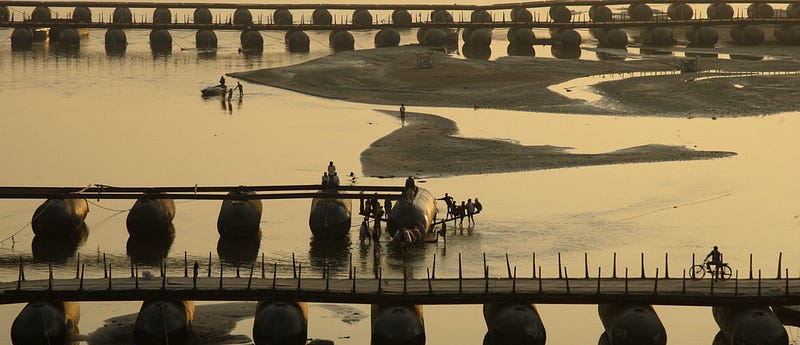
Image: REUTERS/Jitendra Prakash
Attilio Di Battista, Economist, World Economic Forum

India’s GDP per capita (in terms of purchasing power parity) almost doubled between 2007 and 2016, from $3,587 to $6,599. Growth slowed after the 2008 crisis, hitting a decade low in 2012–2013. But if anything, this provided the country with the opportunity to rethink its policies and engage more firmly in the reforms necessary to improve its competitiveness. Growth rebounded in 2014, and last year surpassed that of China.
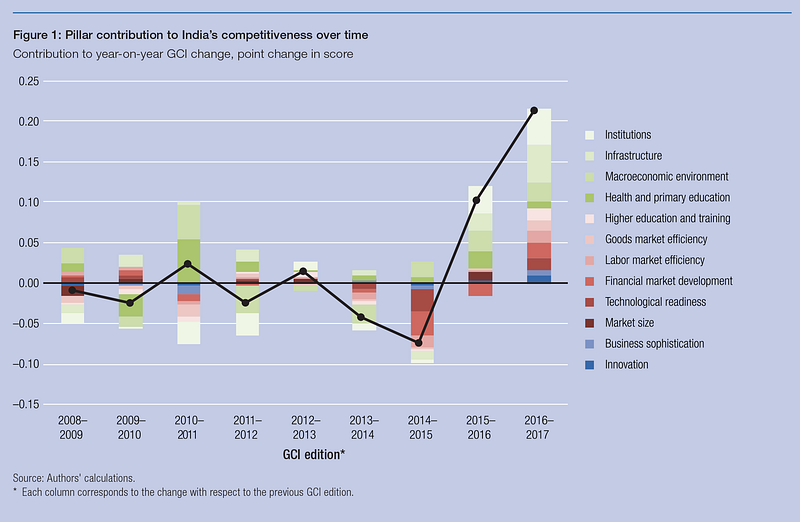
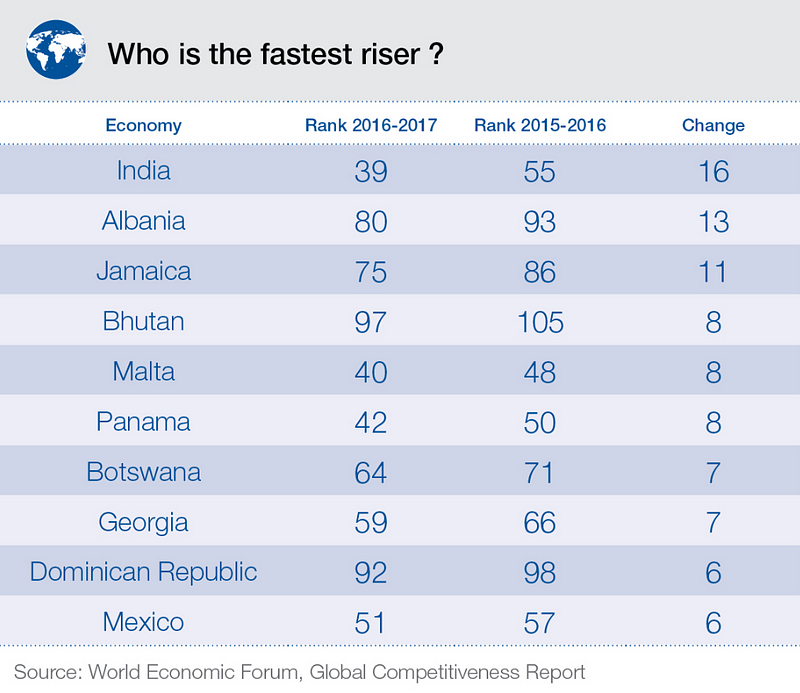
India’s overall competitiveness score was rather stagnant between 2007 and 2014, and the country slipped down the rankings in the Global Competitiveness Report as others made improvements. However, improvements since 2014 have seen it climb to 39th in this year’s edition of the report — up from 48th in 2007–2008. Its overall score improved by 0.19 points in that time.
What makes India so competitive?
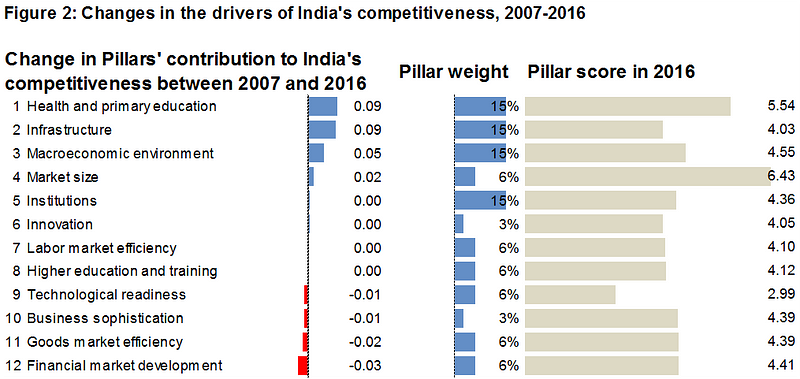
Improvements in health, primary education and infrastructure contributed most to this improvement — although this is partly explained by the relatively large weight these “basic requirements” components have until now been given in factor-driven economies, each accounting for 15% of the final score.
On health and basic education, India almost halved its rate of infant mortality (from 62 to 37.9 per 1,000), increased life expectancy (from 62 to 68) and primary education enrolment (from 88.8% to 93.1%).
Improvements in infrastructure were small and faltering until 2014, when the government increased public investment and accelerated approval procedures to attract private resources. Macroeconomic conditions — the third-biggest positive contributor — followed a similar path: the recent slump in commodity prices has helped India to keep inflation below its target of 5%, while rebalancing its current account and decreasing its public deficit.
Another improvement over the past decade has been increased market size (the adoption of new PPP estimates by the IMF in 2014 also contributed to the upward increase in the measure of market size used in the GCI). Institutions deteriorated until 2014, as mounting scandals and seemingly unmanageable inefficiencies caused businesses to lose trust in the public administration — but this trend was also reversed after 2014, and the institutions score has returned to its 2007 level.
Have you read?
In other areas, India has not yet recovered to 2007 levels, with the biggest shortfall coming in financial market development — this pillar taking 0.03 points off India’s 2016 score in comparison to 2007 (a reduced pillar score of 0.52 points, multiplied by a pillar weight of 6%). The Reserve Bank of India has helped increase financial market transparency, shedding light on the large amounts of non-performing loans previously not reported on the balance sheets of Indian banks. However, the banks have not yet found a way to sell these assets, and in some cases need large recapitalizations.
The efficiency of the goods market has also deteriorated, as India failed to address long-running problems such as different local sales and value added taxes (this is set to finally change as of 2017 if the Central GST and Integrated GST bills currently in parliament are fully implemented). Another area of concern is India’s stagnating performance in technological readiness, a pillar on which it scores one full point lower than any other. These three pillars will be key for India to prosper in its next stage of development, when it will no longer be possible to base its competitiveness on low-cost, abundant labour. Higher education and training has also shown no improvement.
What areas should India prioritize today? India has made significant progress on infrastructure, one of the pillars where it ranked worst. As the country closes the infrastructure gap, new priorities emerge. The country’s biggest relative weakness today is in technological readiness, where initiatives such as Digital India could lead to significant improvements in the next years. India outperforms countries in the same stage of development, mostly those in sub-Saharan Africa, in all pillars except labor market efficiency.
Even on indicators where India has made progress, comparisons with other countries can be sobering: although life expectancy has increased, for example, it is still low by global standards, with India ranking only 106th in the world; and while India almost halved infant mortality, other countries did even better, so it drops nine places this year to 115th. Huge challenges still lie ahead on India’s path to prosperity.
The Global Competitiveness Report 2016–2017 is available here. You can explore the results of the report using the heatmap below.

Originally published at www.weforum.org.

quarta-feira, 14 de junho de 2017

the world’s fastest-growing economies in 2017 - World Economic Forum


These are the world’s fastest-growing economies in 2017
The World Economic Forum, June 14, 2017


 Image: REUTERS/China Daily
Alex Gray, Formative Content


Ethiopia is the fastest-growing economy in 2017, according to the World Bank’s latest edition of Global Economic Prospects.
Ethiopia’s GDP is forecast to grow by 8.3% in 2017. By contrast, global growth is projected to be 2.7%.
The East African country’s accelerating growth comes on the back of government spending on infrastructure.
However, borrowing to finance Ethiopia’s large public infrastructure projects has led to a rise in public debt, which increased by more than 10% of GDP between 2014 and 2016, and now exceeds 50% of GDP.
Many emerging market economies have high levels of public debt, and the World Bank says it is concerned about this because it could drag down growth.
Worsening drought conditions could also affect Ethiopia’s growth, says the report.

The outlook for the world economy
Global growth is predicted to rise by 2.7% on the back of a pick-up in manufacturing and trade, improved market confidence and a recovery in commodity prices.
Trade increased by around 4% in 2017, up from a post-crisis low of 2.4% in 2016. Although it is expected to remain below pre-financial crisis levels.
Image: The World Bank

Growth in emerging markets and developing economies
As this map shows, much of Asia and Africa (in light blue) are experiencing rapid growth.
Emerging-market and developing economies are anticipated to grow 4.1%far faster than advanced economies.

GDP growth across the world


Image: The World bank

The fastest-growing economies
Uzbekistan has the second-fastest-growing economy, with projected growth of 7.6% thanks to rising oil prices, benign global financing conditions, robust growth in the Euro Area, and generally supportive policies among governments of several large countries in the region.
Nepal is next, with a 7.5% projection. Nepal’s growth has rebounded strongly following a good monsoon, reconstruction efforts after the 2015 earthquakeand normalization of trade with India, says the Bank.
India is the fourth-fastest-growing economy with 7.2% projected growth, thanks in part to a rise in exports and an increase in government spending.
Among the other top 10 performers are Djibouti and Laos with 7% and Cambodia, the Philippines and Myanmar with 6.9%.
China, despite experiencing a slowdown and an economic transition, was in 16th place with 6.5% expected growth, helped by robust consumption and a recovery of exports.


Advanced economies
But advanced economies are improving too. Growth in advanced economies is expected to accelerate to 1.9% in 2017, according to the World Bank.
Europe has experienced strong growth, and growth in the United States is expected to recover in 2017 and to continue at a moderate pace in 2018. Japan also saw robust growth at the start of 2017.


Image: The World Bank

A fragile recovery
However, the World Bank warns that the recovery in the global economy is fragile. New trade restrictionssuch as those promised by President Donald Trumpcould hamper global trade, just as uncertainty over policies could hamper investment. Mounting public debt is also of concern to the Bank, because it says borrowing conditionssuch as interest ratescould get tougher, which would affect countries’ economies. Global government debt has risen by 12% of GDP since 2007, to 47% of GDP by 2016.
At the end of 2016, government debt exceeded its 2007 level by more than 10% of GDP in more than half of emerging market and developing economies. Fiscal balancesthe ability of a country to cope with increases in costs of financingworsened from their 2007 levels by more than 5% of GDP in one-third of these countries, says the Bank.
Image: The World Bank

The Bank says that countries now need to undertake institutional and market reforms in order to attract private investment. This will help sustain growth in the long-term.
“The reassuring news is that trade is recovering,” said World Bank Chief Economist Paul Romer.
“The concern is that investment remains weak. In response, we are shifting our priorities for lending toward projects that can spur follow-on investment by the private sector.”

The pitfalls of using GDP
GDP has been has been widely used over the years to measure economic progress. But many argue that it’s not a useful indicator. Nobel Prize winning economist Joseph Stiglitz, IMF head Christine Lagarde and MIT professor Erik Brynjolfsson have all said GDP is a poor indicator of progress, and argued for a change to the way we measure economic and social development.
Alternatives could include measuring jobs, well-being and health. GDP also ignores the impact of important things like climate change.


Originally published at www.weforum.org.

Have you read?
·                5 things to know about Rwanda’s economy

sexta-feira, 30 de setembro de 2016

Como a India se tornou mais competitiva do que a China: Global Competitiveness Report (WEF)

Here’s how India became more competitive than China

Image: REUTERS/Jitendra Prakash
Attilio Di Battista, Economist, World Economic Forum

India’s GDP per capita (in terms of purchasing power parity) almost doubled between 2007 and 2016, from $3,587 to $6,599. Growth slowed after the 2008 crisis, hitting a decade low in 2012–2013. But if anything, this provided the country with the opportunity to rethink its policies and engage more firmly in the reforms necessary to improve its competitiveness. Growth rebounded in 2014, and last year surpassed that of China.
India’s overall competitiveness score was rather stagnant between 2007 and 2014, and the country slipped down the rankings in the Global Competitiveness Report as others made improvements. However, improvements since 2014 have seen it climb to 39th in this year’s edition of the report — up from 48th in 2007–2008. Its overall score improved by 0.19 points in that time.
What makes India so competitive?
Improvements in health, primary education and infrastructure contributed most to this improvement — although this is partly explained by the relatively large weight these “basic requirements” components have until now been given in factor-driven economies, each accounting for 15% of the final score.
On health and basic education, India almost halved its rate of infant mortality (from 62 to 37.9 per 1,000), increased life expectancy (from 62 to 68) and primary education enrolment (from 88.8% to 93.1%).
Improvements in infrastructure were small and faltering until 2014, when the government increased public investment and accelerated approval procedures to attract private resources. Macroeconomic conditions — the third-biggest positive contributor — followed a similar path: the recent slump in commodity prices has helped India to keep inflation below its target of 5%, while rebalancing its current account and decreasing its public deficit.
Another improvement over the past decade has been increased market size (the adoption of new PPP estimates by the IMF in 2014 also contributed to the upward increase in the measure of market size used in the GCI). Institutions deteriorated until 2014, as mounting scandals and seemingly unmanageable inefficiencies caused businesses to lose trust in the public administration — but this trend was also reversed after 2014, and the institutions score has returned to its 2007 level.
Have you read?
In other areas, India has not yet recovered to 2007 levels, with the biggest shortfall coming in financial market development — this pillar taking 0.03 points off India’s 2016 score in comparison to 2007 (a reduced pillar score of 0.52 points, multiplied by a pillar weight of 6%). The Reserve Bank of India has helped increase financial market transparency, shedding light on the large amounts of non-performing loans previously not reported on the balance sheets of Indian banks. However, the banks have not yet found a way to sell these assets, and in some cases need large recapitalizations.
The efficiency of the goods market has also deteriorated, as India failed to address long-running problems such as different local sales and value added taxes (this is set to finally change as of 2017 if the Central GST and Integrated GST bills currently in parliament are fully implemented). Another area of concern is India’s stagnating performance in technological readiness, a pillar on which it scores one full point lower than any other. These three pillars will be key for India to prosper in its next stage of development, when it will no longer be possible to base its competitiveness on low-cost, abundant labour. Higher education and training has also shown no improvement.
What areas should India prioritize today? India has made significant progress on infrastructure, one of the pillars where it ranked worst. As the country closes the infrastructure gap, new priorities emerge. The country’s biggest relative weakness today is in technological readiness, where initiatives such as Digital India could lead to significant improvements in the next years. India outperforms countries in the same stage of development, mostly those in sub-Saharan Africa, in all pillars except labor market efficiency.
Even on indicators where India has made progress, comparisons with other countries can be sobering: although life expectancy has increased, for example, it is still low by global standards, with India ranking only 106th in the world; and while India almost halved infant mortality, other countries did even better, so it drops nine places this year to 115th. Huge challenges still lie ahead on India’s path to prosperity.
The Global Competitiveness Report 2016–2017 is available here. You can explore the results of the report using the heatmap below.

Originally published at www.weforum.org.