Here’s how India became more competitive than China
Attilio Di Battista, Economist, World Economic Forum
India’s GDP per capita (in terms of purchasing power parity) almost doubled between 2007 and 2016, from $3,587 to $6,599. Growth slowed after the 2008 crisis, hitting a decade low in 2012–2013. But if anything, this provided the country with the opportunity to rethink its policies and engage more firmly in the reforms necessary to improve its competitiveness. Growth rebounded in 2014, and last year surpassed that of China.
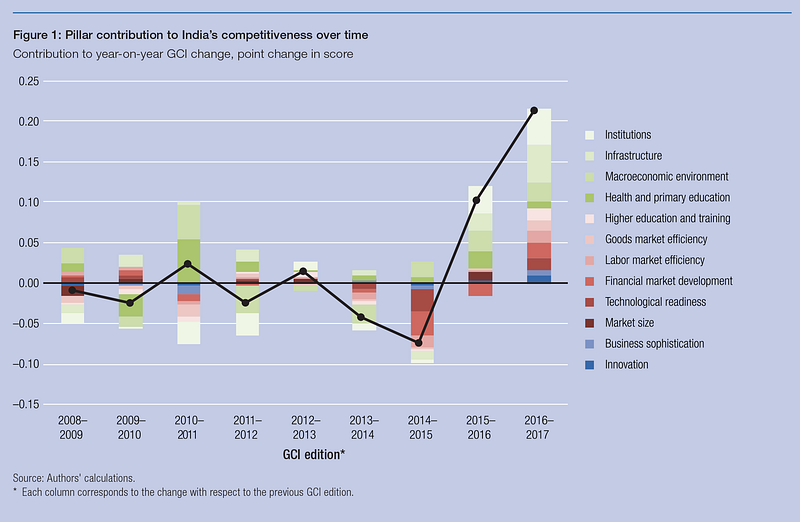
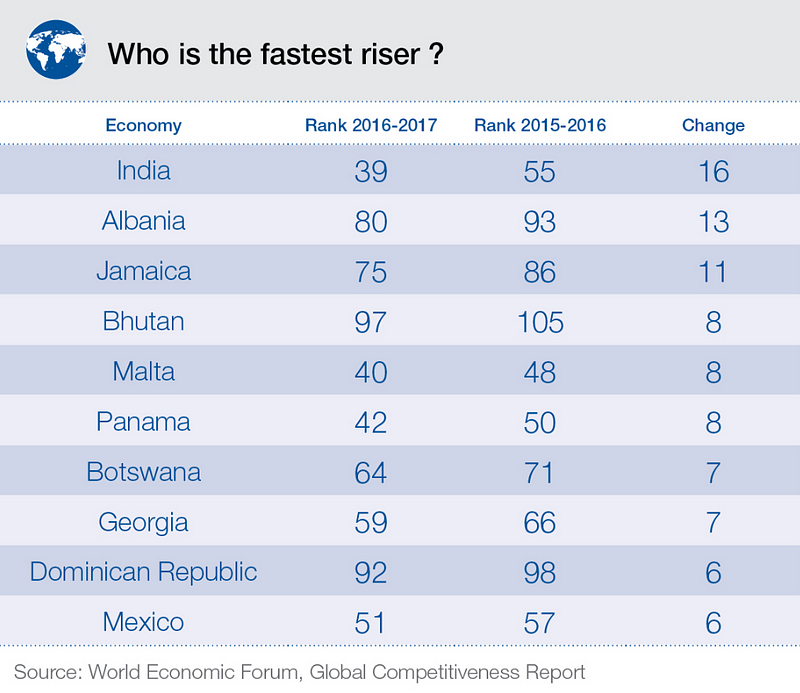
India’s overall competitiveness score was rather stagnant between 2007 and 2014, and the country slipped down the rankings in the Global Competitiveness Report as others made improvements. However, improvements since 2014 have seen it climb to 39th in this year’s edition of the report — up from 48th in 2007–2008. Its overall score improved by 0.19 points in that time.
What makes India so competitive?
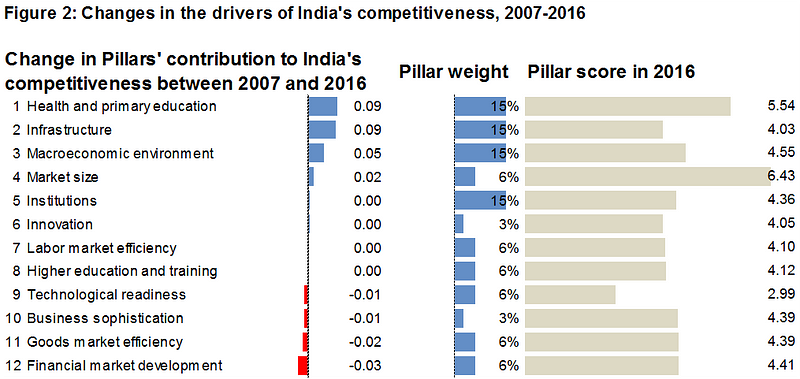
Improvements in health, primary education and infrastructure contributed most to this improvement — although this is partly explained by the relatively large weight these “basic requirements” components have until now been given in factor-driven economies, each accounting for 15% of the final score.
On health and basic education, India almost halved its rate of infant mortality (from 62 to 37.9 per 1,000), increased life expectancy (from 62 to 68) and primary education enrolment (from 88.8% to 93.1%).
Improvements in infrastructure were small and faltering until 2014, when the government increased public investment and accelerated approval procedures to attract private resources. Macroeconomic conditions — the third-biggest positive contributor — followed a similar path: the recent slump in commodity prices has helped India to keep inflation below its target of 5%, while rebalancing its current account and decreasing its public deficit.
Another improvement over the past decade has been increased market size (the adoption of new PPP estimates by the IMF in 2014 also contributed to the upward increase in the measure of market size used in the GCI). Institutions deteriorated until 2014, as mounting scandals and seemingly unmanageable inefficiencies caused businesses to lose trust in the public administration — but this trend was also reversed after 2014, and the institutions score has returned to its 2007 level.
Have you read?
It matters how competitive your country is. Here are three reasons why
What is competitiveness?
These are the world’s most competitive economies
What is competitiveness?
These are the world’s most competitive economies
In other areas, India has not yet recovered to 2007 levels, with the biggest shortfall coming in financial market development — this pillar taking 0.03 points off India’s 2016 score in comparison to 2007 (a reduced pillar score of 0.52 points, multiplied by a pillar weight of 6%). The Reserve Bank of India has helped increase financial market transparency, shedding light on the large amounts of non-performing loans previously not reported on the balance sheets of Indian banks. However, the banks have not yet found a way to sell these assets, and in some cases need large recapitalizations.
The efficiency of the goods market has also deteriorated, as India failed to address long-running problems such as different local sales and value added taxes (this is set to finally change as of 2017 if the Central GST and Integrated GST bills currently in parliament are fully implemented). Another area of concern is India’s stagnating performance in technological readiness, a pillar on which it scores one full point lower than any other. These three pillars will be key for India to prosper in its next stage of development, when it will no longer be possible to base its competitiveness on low-cost, abundant labour. Higher education and training has also shown no improvement.
What areas should India prioritize today? India has made significant progress on infrastructure, one of the pillars where it ranked worst. As the country closes the infrastructure gap, new priorities emerge. The country’s biggest relative weakness today is in technological readiness, where initiatives such as Digital India could lead to significant improvements in the next years. India outperforms countries in the same stage of development, mostly those in sub-Saharan Africa, in all pillars except labor market efficiency.
Even on indicators where India has made progress, comparisons with other countries can be sobering: although life expectancy has increased, for example, it is still low by global standards, with India ranking only 106th in the world; and while India almost halved infant mortality, other countries did even better, so it drops nine places this year to 115th. Huge challenges still lie ahead on India’s path to prosperity.
The Global Competitiveness Report 2016–2017 is available here. You can explore the results of the report using the heatmap below.
Originally published at www.weforum.org.


Nenhum comentário:
Postar um comentário